In this tutorial, we will cover how to run two sample t-test in R, along with examples.

The independent t test evaluates whether the means for two independent groups are significantly different from each other. It is used for just 2 groups of samples. If you have more than 2 groups of samples, you should use ANOVA.
Example : If we compare mean salary of male and female employees and check whether there is a statistical significant difference between the mean salary between them.
- Each score is sampled independently and randomly.
- The scores are normally distributed within each of the two groups.
- The variance in each of the groups is equal.
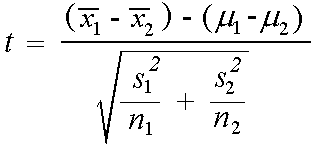
x1-bar and x2-bar are sample means and sample sizes : n1 and n2. Unknown population means- mu1-bar and mu2-bar. s1 and s2 are sample standard deviations.
The paired t test compares the means of two groups that are correlated. In other words, it evaluates whether the means for two paired groups are significantly different from each other. This paired t-test is used in ‘before-after’ studies, or 'case-control' studies.
Example : If we give training to students about R-Programming language and we want to see whether or not the training had any impact on the students' score on R-programming test, we could use the paired sample test.
- Only the paired groups can be used to perform the paired test.
- Each score is sampled independently and randomly.
- The scores are normally distributed within each of the two groups.
- The variance in each of the groups is equal.
Of year 2009 Psychology major students, each student in a random sample of 6 students was asked about their salary package after they completed graduation.
Of year 2015 Psychology major students, each student in a random sample of 6 students was asked about their salary package after they completed graduation.
We wanted to see whether the mean salary offered after graduation has changed over the past 6 years.
Since students from batch of 2009 and 2015 are not same, we should use Independent T-test rather than Paired T-test.
It is a statement that you want to test. It usually states that there is no relationship between the two variables.
In this case, the null hypothesis states that there is no difference between the mean salary offered to students in class 2009 and 2015 batch.
It is contrary to the null hypothesis. It usually states that there is a relationship between the two variables.
In this case, the alternate hypothesis states that there is a difference between the mean salary offered to students in class 2009 and 2015 batch.
1. Define Sample I
batch2009 <- c(567, 759, 1029, 400, 998, 936)
2. Define Sample II
batch2015 <- c(820, 960, 700, 545, 769, 1001)
t.test(batch2009, batch2015, var.equal=FALSE)
When the var.equal argument is set to FALSE in the above syntax, it runs Welch's two sample t-test.
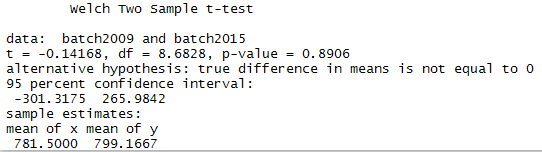
Since p-value of 0.8906 is greater than 0.05, it means we fail to reject the null hypothesis. It implies there is no significant difference between the mean salary offered to students in batch 2009 and batch 2015.
Most statistics textbooks recommend that we first test the assumption that variances are equal with Levene's test. However, most whitepapers prove that in simulations of several studies, Levene’s test fails to reject the null hypothesis that variances are equal even when variances are unequal. Hence, we should always use Welch's two sample t-test.
Welch's t-test performs better than Student's t-test whenever sample sizes and variances are unequal between groups, and gives the same result when sample sizes and variances are equal.
In case you are interested to run Levene Test for Equality of Variance, check the following program :
temp = rbind(data.frame(x=batch2009, group=1), data.frame(x=batch2015, group=2))
temp$group = as.factor(temp$group)
library(car)
leveneTest(temp$x, group = temp$group, center = mean)
In this example, the significance (p value) of Levene's test is 0.2314. Since this value is greater than 5% level of significance (0.05), we fail to reject the null hypothesis that the variability of the two groups is equal, implying that the variances are unequal.
t.test(batch2009, batch2015, var.equal=TRUE)
It returns the same result as shown above in the Welch's Sample T-test result.
xhat1 <- mean(batch2009)
xhat2 <- mean(batch2015)
s1 <- sd(batch2009)
s2 <- sd(batch2015)
n1 <- length(batch2009)
n2 <- length(batch2015)
diff_in_means <- xhat1 - xhat2
SE_diff_mean <- sqrt(s1^2/n1+s2^2/n2)
t_stat <- diff_in_means/SE_diff_mean
t_stat
pvalue = 2* pt(t_stat, df=n1+n2-2)
pvalue
Hospital wants to determine if there's a significant difference in blood pressure before and after the treatment. They collected blood pressure measurements from 10 patients before starting the treatment and then measure it again after the treatment.
before_treatment <- c(150, 155, 160, 165, 170, 155, 157, 159, 162, 168)
after_treatment <- c(140, 145, 150, 155, 160, 145, 147, 150, 155, 160)

# Paired two-sample t-test
result <- t.test(before_treatment, after_treatment, paired = TRUE)

# Print result
print(result)
	Paired t-test

data:  before_treatment and after_treatment
t = 27.652, df = 9, p-value = 5.134e-10
alternative hypothesis: true mean difference is not equal to 0
95 percent confidence interval:
  8.631014 10.168986
sample estimates:
mean difference
            9.4
Since p-value is less than 0.05, it means we reject the null hypothesis. It implies there is a significant difference in blood pressure before and after the treatment.

Deepanshu founded ListenData with a simple objective - Make analytics easy to understand and follow. He has over 10 years of experience in data science. During his tenure, he worked with global clients in various domains like Banking, Insurance, Private Equity, Telecom and HR.
what is the p value in t-test conducted above also for the t-test the ideal thing is to run only two sample t-test since the group of 2009 people are no way related to to the set of students from 2015 , is that correct ?
ReplyDelete