In this article, we will cover the concept of Weight of Evidence (WOE) and Information Value (IV) and how they can be used to improve your predictive model along with the details of how to compute them using SAS, R and Python.
Logistic regression model is one of the most commonly used statistical technique for solving binary classification problem. It is an acceptable technique in almost all the domains. These two concepts - weight of evidence (WOE) and information value (IV) evolved from the same logistic regression technique. These two terms have been in existence in credit scoring world for more than 4-5 decades. They have been used as a benchmark to screen variables in the credit risk modeling projects such as probability of default. They help to explore data and screen variables. It is also used in marketing analytics project such as customer attrition model, campaign response model etc.
What is Weight of Evidence?
The Weight of Evidence (WOE) tells the predictive power of an independent variable in relation to the dependent variable. Since it evolved from credit scoring world, it is generally described as a measure of the separation of good and bad customers. "Bad Customers" refers to the customers who defaulted on a loan. and "Good Customers" refers to the customers who paid back loan.
 |
| WOE Calculation |
Distribution of Goods - % of Good Customers in a particular group
Distribution of Bads - % of Bad Customers in a particular group
ln - Natural Log
Positive WOE means Distribution of Goods > Distribution of BadsMany people do not understand the terms goods/bads as they are from different background than the credit risk. It's good to understand the concept of WOE in terms of events and non-events. It is calculated by taking the natural logarithm (log to base e) of division of % of non-events and % of events.
Negative WOE means Distribution of Goods < Distribution of Bads
Hint : Log of a number > 1 means positive value. If less than 1, it means negative value.
WOE = In(% of non-events ➗ % of events)
 |
| Weight of Evidence Formula |
How to calculate Weight of Evidence?
Follow the steps below to calculate Weight of Evidence
- For a continuous variable, split data into 10 parts (or lesser depending on the distribution).
- Calculate the number of events and non-events in each group (bin)
- Calculate the % of events and % of non-events in each group.
- Calculate WOE by taking natural log of division of % of non-events and % of events
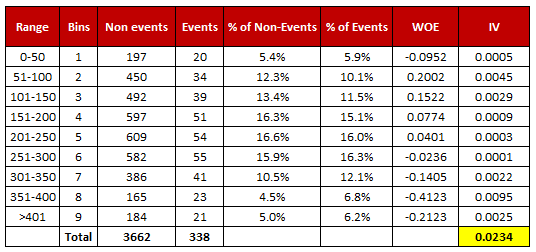 |
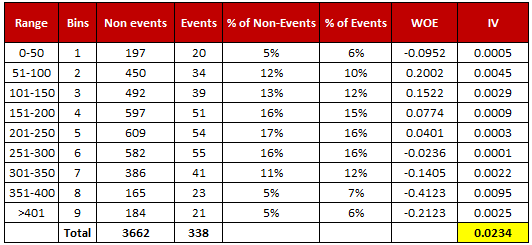
| Weight of Evidence and Information Value Calculation |
Download : Excel Template for WOE and IV
Terminologies related to WOE
1. Fine ClassingCreate 10/20 bins/groups for a continuous independent variable and then calculates WOE and IV of the variable2. Coarse Classing
Combine adjacent categories with similar WOE scores
Usage of WOE
Weight of Evidence (WOE) helps to transform a continuous independent variable into a set of groups or bins based on similarity of dependent variable distribution i.e. number of events and non-events.For continuous independent variables : First, create bins (categories / groups) for a continuous independent variable and then combine categories with similar WOE values and replace categories with WOE values. Use WOE values rather than input values in your model.
data age1;
set age;
if age = . then WOE_age = 0.34615;
if age >= 10 then WOE_age = -0.03012;
if age >= 20 then WOE_age = 0.07689;
run;

proc logistic data=age1 descending;
model y = WOE_age;
run;
For categorical independent variables : Combine categories with similar WOE and then create new categories of an independent variable with continuous WOE values. In other words, use WOE values rather than raw categories in your model. The transformed variable will be a continuous variable with WOE values. It is same as any continuous variable.
Why combine categories with similar WOE?
It is because the categories with similar WOE have almost same proportion of events and non-events. In other words, the behavior of both the categories is same.- Each category (bin) should have at least 5% of the observations.
- Each category (bin) should be non-zero for both non-events and events.
- The WOE should be distinct for each category. Similar groups should be aggregated.
- The WOE should be monotonic, i.e. either growing or decreasing with the groupings.
- Missing values are binned separately.
AdjustedWOE = ln (((Number of non-events in a group + 0.5) / Number of non-events)) / ((Number of events in a group + 0.5) / Number of events))
How to check correct binning with WOE
1. The WOE should be monotonic i.e. either growing or decreasing with the bins. You can plot WOE values and check linearity on the graph.2. Perform the WOE transformation after binning. Next, we run logistic regression with 1 independent variable having WOE values. If the slope is not 1 or the intercept is not ln(% of non-events / % of events) then the binning algorithm is not good. [Source : Article]
Benefits of Weight of Evidence
Here are some benefits of Weight of Evidence and how it can be used to improve your predictive model.
- It can treat outliers. Suppose you have a continuous variable such as annual salary and extreme values are more than 500 million dollars. These values would be grouped to a class of (let's say 250-500 million dollars). Later, instead of using the raw values, we would be using WOE scores of each classes.
- It can handle missing values as missing values can be binned separately.
- Since WOE Transformation handles categorical variable so there is no need for dummy variables.
- WoE transformation helps you to build strict linear relationship with log odds. Otherwise it is not easy to accomplish linear relationship using other transformation methods such as log, square-root etc. In short, if you would not use WOE transformation, you may have to try out several transformation methods to achieve this.
What is Information Value?
Information value (IV) is one of the most useful technique to select important variables in a predictive model. It helps to rank variables on the basis of their importance. The IV is calculated using the following formula :
IV = ∑ (% of non-events - % of events) * WOE
| Information Value Formula |
Rules related to Information Value
| Information Value | Variable Predictiveness |
|---|---|
| Less than 0.02 | Not useful for prediction |
| 0.02 to 0.1 | Weak predictive Power |
| 0.1 to 0.3 | Medium predictive Power |
| 0.3 to 0.5 | Strong predictive Power |
| >0.5 | Suspicious Predictive Power |
According to Siddiqi (2006), by convention the values of the IV statistic in credit scoring can be interpreted as follows.
If the IV statistic is:- Less than 0.02, then the predictor is not useful for modeling (separating the Goods from the Bads)
- 0.02 to 0.1, then the predictor has only a weak relationship to the Goods/Bads odds ratio
- 0.1 to 0.3, then the predictor has a medium strength relationship to the Goods/Bads odds ratio
- 0.3 to 0.5, then the predictor has a strong relationship to the Goods/Bads odds ratio.
- > 0.5, suspicious relationship (Check once)
- Information value increases as bins / groups increases for an independent variable. Be careful when there are more than 20 bins as some bins may have a very few number of events and non-events.
- Information value is not an optimal feature (variable) selection method when you are building a classification model other than binary logistic regression (for eg. random forest or SVM) as conditional log odds (which we predict in a logistic regression model) is highly related to the calculation of weight of evidence. In other words, it's designed mainly for binary logistic regression model. Also think this way - Random forest can detect non-linear relationship very well so selecting variables via Information Value and using them in random forest model might not produce the most accurate and robust predictive model.
Python, SAS and R Code : WOE and IV
R Code
Follow the steps below to calculate Weight of Evidence and Information Value in R
Step 1 : Install and Load PackageFirst you need to install 'Information' package and later you need to load the package in R.
install.packages("Information")
library(Information)
Step 2 : Import your data
#Read Data
mydata <- read.csv("https://stats.idre.ucla.edu/stat/data/binary.csv")
Step 3 : Summarise DataIn this dataset, we have four variables and 400 observations. The variable admit is a binary target or dependent variable.
summary(mydata)
     admit            gre           gpa            rank
 Min.   :0.000   Min.   :220   Min.   :2.26   Min.   :1.00
 1st Qu.:0.000   1st Qu.:520   1st Qu.:3.13   1st Qu.:2.00
 Median :0.000   Median :580   Median :3.40   Median :2.00
 Mean   :0.318   Mean   :588   Mean   :3.39   Mean   :2.48
 3rd Qu.:1.000   3rd Qu.:660   3rd Qu.:3.67   3rd Qu.:3.00
 Max.   :1.000   Max.   :800   Max.   :4.00   Max.   :4.00
Step 4 : Data Preparation
Make sure your independent categorical variables are stored as factor in R. You can do it by using the following method -
mydata$rank <- factor(mydata$rank)Important Note : The binary dependent variable has to be numeric before running IV and WOE as per this package. Do not make it factor.
IV <- create_infotables(data=mydata, y="admit", bins=10, parallel=FALSE)It takes all the variables except dependent variable as predictors from a dataset and run IV on them.
This function supports parallel computing. If you want to run you code in parallel computing mode, you can run the following code.
IV <- create_infotables(data=mydata, y="admit", bins=10, parallel=TRUE)You can add ncore= parameter to mention the number of cores to be used for parallel processing.
Information Value in R In IV list, the list Summary contains IV values of all the independent variables.
IV_Value = data.frame(IV$Summary)
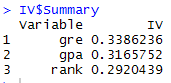 |
| Information Value Scores |
print(IV$Tables$gre, row.names=FALSE)
print(IV$Tables$gre, row.names=FALSE)
       gre  N Percent     WOE    IV
 [220,420] 38  0.0950 -1.3748 0.128
 [440,480] 40  0.1000 -0.0820 0.129
 [500,500] 21  0.0525 -1.4860 0.209
 [520,540] 51  0.1275  0.2440 0.217
 [560,560] 24  0.0600 -0.3333 0.223
 [580,600] 52  0.1300 -0.1376 0.225
 [620,640] 51  0.1275  0.0721 0.226
 [660,660] 24  0.0600  0.7653 0.264
 [680,720] 53  0.1325  0.0150 0.265
 [740,800] 46  0.1150  0.7653 0.339
To save it in a data frame, you can run the command below-
gre = data.frame(IV$Tables$gre)
plot_infotables(IV, "gre")
 |
| WOE Plot |
To generate multiple charts on one page, you can run the following command -
plot_infotables(IV, IV$Summary$Variable[1:3], same_scale=FALSE)
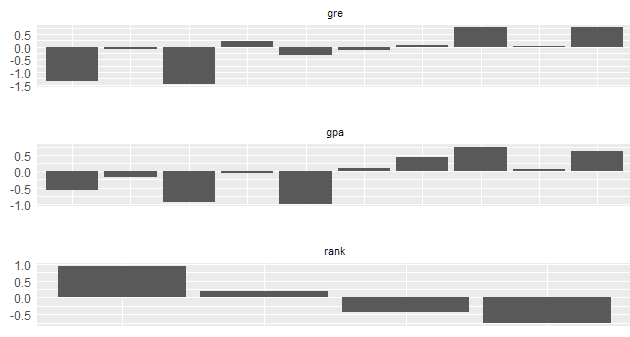 |
| MultiPlot WOE |
Important Point
It is important to note here the number of bins for 'rank' variable. Since it is a categorical variable, the number of bins would be according to unique values of the factor variable. The parameter bins=10 does not work for a factor variable.
Python Code
Here are the steps on how to calculate Weight of Evidence and Information Value in Python:
Load Required Python PackagesYou can import packages by using import module in Python. The 'as' keyword is used for alias. Instead of using the package name, we can use alias to call any function from the package.
#Load Required Packages
import pandas as pd
import numpy as np
By using
read_csv( ) function, we can read CSV file into Python.
#Read Data
mydata = pd.read_csv("https://stats.idre.ucla.edu/stat/data/binary.csv")
Python Function to calculate Information Value and WOE
def iv_woe(data, target, bins=10, show_woe=False):

    #Empty Dataframe
    newDF,woeDF = pd.DataFrame(), pd.DataFrame()

    #Extract Column Names
    cols = data.columns

    #Run WOE and IV on all the independent variables
    for ivars in cols[~cols.isin([target])]:
        if (data[ivars].dtype.kind in 'bifc') and (len(np.unique(data[ivars]))>10):
            binned_x = pd.qcut(data[ivars], bins,  duplicates='drop')
            d0 = pd.DataFrame({'x': binned_x, 'y': data[target]})
        else:
            d0 = pd.DataFrame({'x': data[ivars], 'y': data[target]})
        d0 = d0.astype({"x": str})
        d = d0.groupby("x", as_index=False, dropna=False).agg({"y": ["count", "sum"]})
        d.columns = ['Cutoff', 'N', 'Events']
        d['% of Events'] = np.maximum(d['Events'], 0.5) / d['Events'].sum()
        d['Non-Events'] = d['N'] - d['Events']
        d['% of Non-Events'] = np.maximum(d['Non-Events'], 0.5) / d['Non-Events'].sum()
        d['WoE'] = np.log(d['% of Non-Events']/d['% of Events'])
        d['IV'] = d['WoE'] * (d['% of Non-Events']-d['% of Events'])
        d.insert(loc=0, column='Variable', value=ivars)
        print("Information value of " + ivars + " is " + str(round(d['IV'].sum(),6)))
        temp =pd.DataFrame({"Variable" : [ivars], "IV" : [d['IV'].sum()]}, columns = ["Variable", "IV"])
        newDF=pd.concat([newDF,temp], axis=0)
        woeDF=pd.concat([woeDF,d], axis=0)

        #Show WOE Table
        if show_woe == True:
            print(d)
    return newDF, woeDF
In this user-defined function, there are 4 parameters user needs to mention.datameans data frame in which dependent and independent variable(s) are stored.targetrefers to name of dependent variable.binsrefers to number of bins or intervals. By default, it is 10.show_woe = Truemeans you want to print the WOE calculation Table. By default, it is False
iv, woe = iv_woe(data = mydata, target = 'admit', bins=10, show_woe = True)
print(iv)
print(woe)
Important Points related to Python Script
- Dependent variable specified in target parameter must be binary. 1 refers to event. 0 refers to non-event.
- All numeric variables having no. of unique values less than or equal to 10 are considered as a categorical variable. You can change the cutoff in the code len(np.unique(data[ivars]))>10
- IV score generated from python code won't match with the score derived from R Package as pandas function
qcut( )does not include lowest value of each bucket. It DOES NOT make any difference in terms of interpretation or decision making based on WOE and IV result.
SAS Code
Here is the SAS program that demonstrates how to calculate the Weight of Evidence and Information Value:
/* IMPORT CSV File from URL */
FILENAME PROBLY TEMP;
PROC HTTP
 URL="https://stats.idre.ucla.edu/stat/data/binary.csv"
 METHOD="GET"
 OUT=PROBLY;
RUN;

OPTIONS VALIDVARNAME=ANY;
PROC IMPORT
  FILE=PROBLY
  OUT=WORK.MYDATA REPLACE
  DBMS=CSV;
RUN;


PROC HPBIN DATA=WORK.MYDATA QUANTILE NUMBIN=10;
INPUT GRE GPA;
ODS OUTPUT MAPPING = BINNING;
RUN;

PROC HPBIN DATA=WORK.MYDATA WOE BINS_META=BINNING;
TARGET ADMIT/LEVEL=BINARY ORDER=DESC;
ODS OUTPUT INFOVALUE = IV WOE = WOE_TABLE;
RUN;
NUMBIN=refers to number of bins you want to create in WOE calculation.INPUTrefers to all the continuous independent variablesTARGETSpecify target or dependent variable against this statementORDER=DESCtells SAS that 1 refers to event in your target variable
Output values of WOE and IV using above SAS and Python code would match exactly. R package Information implemented slightly different algorithm and cutoff technique so its returned values may differ with the values from Python and SAS code but difference is not huge and interpretation remains same.

Deepanshu founded ListenData with a simple objective - Make analytics easy to understand and follow. He has over 10 years of experience in data science. During his tenure, he worked with global clients in various domains like Banking, Insurance, Private Equity, Telecom and HR.
Why should WOE be monotonic? For example, when there is U/inverse U relationship between independent variable and outcome.
ReplyDeleteIt is because logistic regression assumes there must be a linear relationship between logit function and independent variable.
Deletein health insurance... incidence (event or disease) rate is higher in infant/toddler and then older people. People with age in the middle has the lowest incidence rate. How could this be a monotonic WOE? But this can be modeled by logistic regression, with age as categories.
DeleteGroupings doesnt mean categorical data but continuous data....That is the variables that are directly used as a feature in logistic regression. Am sure age is not directly used as a variable in that case. We categorize age into groups to solve that problem.
DeleteCan I ask for your help? I am a first time SPSS user. I need to calculate WOE and IV for more than thousands of variables in a SPSS dataset. Can you tell me how to write a SPSS macro to calculate WOE and IV automatically and output the result?
ReplyDeleteI have been struggling for a month how to do it already and really need your help.
Dont know for SPSS, but in R you can use *Information* package and *smbinning* package.
DeleteMay I get the SAS code for doing fine classing to fit a logistic regression model ? I am using base SAS
ReplyDeleteThis is a question regarding a practice or method followed by some of my colleagues. While making a logistic regression model, I have seen people replace categorical variables (or continuous variables which are binned) with their respective Weight of Evidence (WoE). This is supposedly done to establish a monotonic relation between the regressor and dependent variable. Now as far as I understand, once the model is made, the variables in the equation are NOT the variables in the dataset. Rather, the variables in the equation are now kind of the importance or weight of the variables in segregating the dependent variable!
ReplyDeleteMy question is : how do we now interpret the model or the model coefficients? For example for the following equation :
log(p/1−p)=β0+β1x1
we can say that exp(β1)
is the relative increase in odd's ratio for 1 unit increase in the variable x1
.
But if the variable is replaced by its WoE, then the interpretation will be changed to : relative increase in odd's ratio for 1 unit increase in the IMPORTANCE / WEIGHT of the variable
Please help me understand what I am missing.
Your understanding is correct. It's difficult to interpret the coefficient of a variable once it is replaced with WOE values. But we sometimes focus on improving the accuracy of a predictive model and give less priority interpreting the coefficients.
DeleteVery well written however I think the place where you say value greater than 0.3 the predictor does have a strong relationship with the odds ratio however we don't take values over 0.5 as well. I hope my understanding is correct or I am missing anything
ReplyDeleteThere is no clear cut rule. Sometimes IV values above 0.5 make sense and sometimes not. We should be cautious if IV value is very high.
Deletei think the Formula its OK, when you make a binary logistic regression you said; "0" if the event does not occur, for the other hand you said "1" if the event occur. it can be confusing, maybe, include an example can help.
ReplyDeletebest regards from Chile.
PD: Sorry for my english, can you help me whit a problem?
When the IV it more than 1 (i know that more than 0.5 it suspect), that is becouse it very wrong or its a very good predictor?
It is because IV can be misleading when it is greater than 1. For example, a categorical variable with high number of levels (let's say 50) generally have IV value more than 1.
DeleteThanks for the article Deepanshu. very insightful
DeleteBut what if we get IV value > 1 for a continuous variable and bins we created are less then 10.
Should we user this feature in logistic regression.
Hi Deepanshu, I want to say thank you to you for this easy explanation of WOE , IV and everything. I have a doubt, when calculating WOE for categorical variable, how to create bin/group? Ex :categorical Var - Region ( North, East, South, West ).
ReplyDeleteCategorical variables have their own groups/bins. For example, North /South are groups of variable region. Then you can calculate number of events and non-events in each group. Hope it helps!
DeleteThanks for this. Please help me to calculate WOE in R package, I am trying to download all type of packages, but none of them are working. Like,
ReplyDeleteinstall.packages("devtools")
library("devtools")
install_github("tomasgreif/riv")
install_github("InformationValue")
which package should I use to calculate WOE and IV in R ?
what is the code for this calculation ?
Did you try Information package?
Deleteinstall.packages("Information")
library(Information)
Read up the manual guide of this package.
Hi Deepanshu, I have tried Information package and it works. Thanks for this.
ReplyDeleteI have one doubt in logistic regression, normally we are dividing our data into Train and Test. If there are lot of negative responses in the data, then what is the procedure to divide the data into train and test ? normally Train > Test, what will be the scenario in this case?
I will be thank full to you if you have time to acknowledge this.
I believe you have a typing error in this chunk of code:
ReplyDeleteif age >= 10 then WOE_age = -0.03012;
else if age >= 20 then WOE_age = 0.07689;
else if age >= 30 then WOE_age = . ;
If age is (not larger) than 10, it cannot be larger than 20.
Nice article, anyway.
Thanks for pointing it out. Corrected. Cheers!
DeleteHi Deepanshu,
ReplyDeleteIf no of events for a particular bin is zero, woe would be 'not defined' because of log function. Is is recommended to replace it by some value based on subject expertise or advisable to leave it as zero. Please help. Thanks
I have added a method to treat these cases. Hope it helps!
DeleteHi Deepanshu,
ReplyDeleteI assume the events & non-events used in WOE calculation are possible only when the Dependent variable is binary variable. What should we do when it is a multi leveled DV?
Correct me if my assumption is wrong
Yes, it is for binary dependent variable. Use other variable selection method such as wald-chisquare for multinomial logistic regression.
DeleteThanks
ReplyDeletehi. i learn before, that woe have opposite value with bad_rate.
ReplyDeleteCan we calculate event% and non-event% after we get the WOE and IV? (so we can get event_rate)
Because, the formula of Information::create_infotables only get the Percentage of N (total) of those binning. And formula WOE(Data,Independent,Continuous,Bin,Bad,Good) has different calculation/answer with Information::create_infotables
As WOE variables are sensitive to the event rate what adjustment do you suggest for handling unbalanced sample to apply oversampling? Do you suggest using WOE variables out of original sample and only adjusting the model coefficients for getting rid of oversampling effect?
ReplyDeleteThanks Deepanshu for such a nice explanation about WOE and IV.
ReplyDeleteHi. Mr. Deepanshu Bhalla!!!. When you indicate that: "Information value should not be used as a feature selection method when you are building a classification model other than binary logistic regression (for eg. random forest or SVM) as it's designed for binary logistic regression model only." which one(s) is (are) the reason(s), to establish that important point as a warning??? Thanks.
ReplyDeleteHi Deepanshu,
ReplyDeleteThanks for sharing amazing and very well organised information.
when we replace continuous variable with woe and it come as significant variable in model then how to interpret it . for ex. how to interpret WOE_age with respect to logistic regression model on y(purchase or not purchase).
Regards
Yogesh
Hi Deepanshu,
ReplyDeletethanks for amazing article on woe/iv.
Can you please explain what can be done if woe values are not monotonic with bins i.e they are both increasing and decreasing with bin no. , Is the binning incorrect ? should similar values be clubbed into one bin to make woe monotonic ?
How do we calculate IV value for numeric(not binary) dependent variable?
ReplyDeletei am getting inf values in attributes ,how should be aware from getting inf values
ReplyDeleteUse this line for loading data
ReplyDeletemydata <- read.csv("https://stats.idre.ucla.edu/stat/data/binary.csv")
Hi Deepanshu,
ReplyDeleteCan any variable have IV value greater than 1 ? If so, what does that mean ?
Great Article - One question though. Why do the independent variables need to be loaded as factors in R?
ReplyDeleteHello, very Nice explanation to this. But I have a question. Is this method just restricted to logistic regression or can be used for linear regression as well? Because in SAS I was able to calculate WoE and IV without informing the code that my target was continous and the variables that I used like Age was not put into categories just actual values.
ReplyDeleteIt's restricted to binary target variable. Can you show me the code which you are using for calculating WOE and IV?
ReplyDeleteHi Deepanshu,
ReplyDeleteGreat post.Just found the URL is not working:
mydata <- read.csv("http://www.ats.ucla.edu/stat/data/binary.csv")
and following works fine:
mydata <- read.csv("https://stats.idre.ucla.edu/stat/data/binary.csv")
Thanks for pointing it out. Cheers!
DeleteHi Deepanshu! :)
ReplyDeleteWhy shouldn't IV be used in model classification other than binary logistic regression (random forest and SVM)? I don't understand it. Thanks for help!
i want to know the reason too!
DeleteI added the reason in the article. Thanks!
DeleteHi Deepanshu,
ReplyDeleteCan we use WOE replacement of variables for models(data other than credit or finance data) other than credit risk models? Also what is the best variable transformation technique for the categorical variable having more than 30-40 levels?
Thanks,
can we use WOE values for Random Forest/ Tree based Algorithms, (without using IV as you have mentioned in the article)? I think WOE simplifies handling categorical fields.
ReplyDeleteYes, you can use. I don't see any issue in using WOE instead of categorical values. Thanks!
DeleteThank You Deepanshu for the reply!
DeleteBy the way, good and clear explanation of WOE/ IV. It helps.
Hi, Thanks for a great article. Very helpful .
ReplyDeleteCan you please help me understand how are WOE coefficients used for prediction/validation? do we first convert the validation/test sample into WOE and then apply the WOE output for prediction?
Thanks for the nice explanation on this. The first table could use a small improvement. The first row and last row, both with 5% and 6%, give different results due to rounding. The results are so different that I thought there was an error in the computation. Adding an extra digit of precision to the table would help.
ReplyDeleteMakes sense. I made the desired changes in the table. Cheers!
DeleteThanks for this
ReplyDeleteHow would i extract the Cutoff part to be two columns?
Hi, Thanks for the article, one question please,
ReplyDeleteAs WOE and IV scales the data based on contribution of outcome, can this be used as a normalisation step in machine learning model development instead of using different things like log-transformation, onehotencoding, labelencoding, min-max standardisation.....etc, As all this transformation specific to each column, here woe and iv scales using predictive powers of the target column. Thanks
Yes it standardise values which can be used for comparison between categories of a categorical variable and comparison across variables.
ReplyDeleteCan we use proc rank to split data into 10 parts and then calculate Event and non event rate, instead of proc hpbin
ReplyDeleteYes we can. That's what everyone has been using before proc hpbin procedure was implemented in SAS.
DeleteHi Deepanshu Bhalla, thank you for the explanation. WOE and IV can be used to build a scorecard model to give a customer, i.e a loan applicant, a score to determine whether "good" or "bad". But can I use the similar technique to score a company? If I need to analyze 1000+ customer companies, and I have 10+ attributes (similar to the loan/borrower attributes, but these are at company level) of each company, can I build a scorecard using WOE/IV and logistical regression? So far, the biggest question I have is, not like loan, Company doesn't "default/fail" that often. In the history, I have seen only 2 or 3 customer companies failed before. If WOE/IV and logistical regression are not suitable in this case, do you have any suggestions as to how to build a scorecard model?
ReplyDeleteHi Deepanshu,
ReplyDeleteMy woe values for a variable are wavy like shown below:
Variable Cutoff N Events % of Events Non-Events % of Non-Events WoE IV
0 Amount (-0.001, 1.0] 30492 181 0.367886 30311 0.106611 1.238590 3.236134e-01
1 Amount (1.0, 3.57] 26473 27 0.054878 26446 0.093017 -0.527664 2.012431e-02
2 Amount (3.57, 8.91] 28559 36 0.073171 28523 0.100322 -0.315588 8.568554e-03
3 Amount (8.91, 13.0] 28405 13 0.026423 28392 0.099861 -1.329554 9.764019e-02
4 Amount (13.0, 22.0] 28714 14 0.028455 28700 0.100944 -1.266236 9.178828e-02
5 Amount (22.0, 37.0] 28375 17 0.034553 28358 0.099741 -1.060092 6.910594e-02
6 Amount (37.0, 59.8] 28366 24 0.048780 28342 0.099685 -0.714687 3.638094e-02
7 Amount (59.8, 100.0] 28915 50 0.101626 28865 0.101525 0.000997 1.010233e-07
8 Amount (100.0, 203.0] 28050 45 0.091463 28005 0.098500 -0.074117 5.215200e-04
9 Amount (203.0, 25691.16] 28458 85 0.172764 28373 0.099794 0.548817 4.004719e-02
Even if i club adjacent bins i dont see there is any monotonic pattern in woe. What can be done in such case?
Does the skewness of a dataset in terms of event% being very low (~0.5%) as compared to non-event% impact the value of IV ?
ReplyDeleteNope because calculation of IV considers percentages rather than count.
DeleteIn my data there is a strong asymmetry in the possible values. Does this mean that I cannot use this approach? Example below:
ReplyDeleteage events
[1-28] 4000
[28-31] 5000
[31-33] 3500
[33-35] 600
etc...
It seems that grouping doesn't satisfy 5% rule...
Clear and useful.
ReplyDeleteThank you!
Thank you very much for this useful article. Can you please help me in how do we get the woe values as varaibles in the original data frame IN python so that we can proceed for the modeling
ReplyDeleteHi Deepanshu..thank you for the article..I have done the above approach in my model building process.I had a question.Can I get the explaination of the coefficient of any categorical variable on the log odds.If the variables has 4 levels after doing the WOE approach and it comes significant then what does the coefficient say about the variable.The coeff for state variable being 2.5(say) what does it say about the probability or log odds ?
ReplyDeleteHi Deepanshu , my some coefficients are coming negative post woe transformation variable what does this means?
ReplyDeleteGreat article on WOW and IV. Excellent read!
ReplyDeleteI was hoping if you could shed some light on arriving at the final IV value of a variable. From what i gather, IV value of a variable is a summation of IVs from all bins of that variable. However, when i leverage Information package in R and iv$Summary to look into IV values, it doesn't output the final IV instead the IV value of the last bin is captured.
I am trying to extract IVs for each variable and when looked into the WOE table, i noticed the IV reported by Summary function reflects the IV of one of the bins of the variable and not the summation. Appreciate any help. Thanks
Hello, please does IV only work for binary dependent variables? I tried it on multi-class dependent variable but it's not working. Thanks.
ReplyDeleteYes it works only for binary dependent variable
DeleteOk well noted. Thank you very much for the quick response.
DeleteVery good article.
ReplyDeletecan we use IV for survival analysis model?
ReplyDeleteHello, great explanation on WOE and IV.
ReplyDeleteI have a remark on Python code for following lines:
d['WoE'] = np.log(d['% of Events']/d['% of Non-Events'])
d['IV'] = d['WoE'] * (d['% of Events'] - d['% of Non-Events'])
Shouldn't be :
d['WoE'] = np.log(d['% of Non-Events'] / d['% of Events'])
d['IV'] = d['WoE'] * (d['% of Non-Events'] - d['% of Events'])
as both formulas consider Non-Events / Events and Non-Events - Events respectively as you described in this article (and from theory).
Nevertheless, the result is the same in the end.
Raluca
Hi Deepanshu, I dont think your python code considers missing category in calculating WOE and IV.
ReplyDeleteFixed it. Thanks!
DeleteAmazing blog.
ReplyDeleteThanks for the article. For the 5% Rule, should we consider the missing bin?
ReplyDeletei.e:
We consider Missing records as separate bins. If that Missing bins has less than 5% of records, then what should be done.
Inorder to check the bin_size:
I used ((# of records in that bin / Total # of records) < 0.05).any(). Return True if any one of the bin size is less than 5%.
Thank you for the article. I am confused by what you wrote about the WoE and the actual formula. You wrote, "Positive WOE means Distribution of Goods > Distribution of Bads
ReplyDeleteNegative WOE means Distribution of Goods < Distribution of Bads
Hint : Log of a number > 1 means positive value. If less than 1, it means negative value."
and your formula - when you first introduced it at the top of the article - is congruent with this:
WOE = ln(Dist of Goods / Dist of Bads)
However, later in the article you wrote the formula as:
WoE = ln(% of non-events / % of events), which is the opposite of your first version of the formula.
Then the Weight of Evidence and Information Value Calculation Table contradicts what you wrote above about a positive of negative WoE. For example, in the range 0-50 the % of Events (5.9) is greater than the % of Non-Events (5.4), yet the WoE is negative. Likewise, in the range 51-100 the % of Events (10.1) is less than the % of Non-events (12.3), yet the WoE is positive. Which formula is correct, and would you please help me clear up the confusion? Thanks.
In credit risk domain, bad customers are "events" because we are interested in the probability of default. Hope it helps!
DeleteThanks! https://www.listendata.com/2015/03/weight-of-evidence-woe-and-information.html?sc=1663169654969#c966867219846697236
ReplyDelete