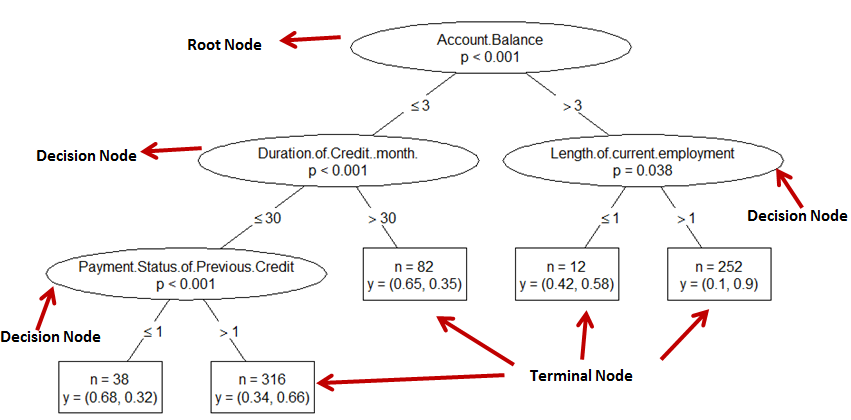
Suppose you want to change a look of default decision tree generated by CTREE function in the party package in R.
 |
| Decision Tree Custom Ctree Plot |
Create Sample Data
Let's create a sample data for demonstration purpose. Here we created a binary variable for using it as a target variable in the decision tree.
library(dplyr)
iris2 <- iris %>%
  mutate(Target = as.factor(ifelse(Species == "setosa", "Setosa", "Not Setosa"))) %>%
  select(-Species)
The ctree function is used to create the tree and then the plot function is used with custom panel functions to customize the look of the tree.
library(party)
t1.prior <- ctree(Target ~ ., data = iris2)
plot(t1.prior, type="simple",
     inner_panel=node_inner(t1.prior,abbreviate = FALSE, pval = TRUE, id = FALSE),
     terminal_panel=node_terminal(t1.prior, abbreviate = FALSE, digits = 2, fill = c("white"),id = FALSE)
)
How does the above code work?
ctree(Target ~ ., data = iris2):This line creates a conditional inference tree model with the binary target variableTargetand all other variables in theiris2dataset as independent variables.plot(...):This is used to plot the created tree with the following customizations.type="simple":Specifies the type of plot, which is a simple plot.inner_panel=...:Specifies the custom panel for inner nodes using thenode_innerfunction. Theabbreviateargument is set toFALSEto display full variable names,pval = TRUEdisplays p-values, andid = FALSEhides the node IDs.terminal_panel=...:Specifies the custom panel for terminal nodes using thenode_terminalfunction. Theabbreviateargument is set toFALSEto display full variable names,digits = 2sets the number of digits displayed,fill = c("white")sets the fill color for terminal nodes, andid = FALSEhides the node IDs.


Share Share Tweet