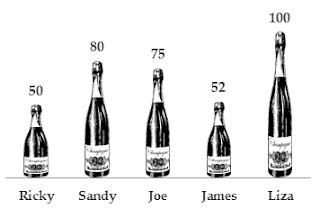
Are you bored with the standard chart colors?
If yes, what can be an alternative to the colors? A cool picture?? Yeah !!! Read the article below.
If yes, what can be an alternative to the colors? A cool picture?? Yeah !!! Read the article below.
Either give me more wine or leave me alone ― Rumi, circa 1200′s
1. Create a simple column chart
On the Insert tab, in the Charts group, click Column >> In the 2-D Column, click Clustered Column.2. Select the chart columns. It displays the Chart Tools, adding the Design, Layout, and Format tabs.
3. Fill the chart with picture
On the Format, in the Shape Styles group, click Shape Fill >> click Picture.
Browse the picture that you want to fill, and then double-click it.Download the workbook


hello,please,I want to compute eigen value and eigen vector with excel, help me
ReplyDelete