Unlike SAS and SPSS, R has several different data types (structures) including vectors, factors, data frames, matrices, arrays and lists. The data frame structure is more like a spreadsheet in MS Excel.
A vector is an object that contains a set of values called its elements.
x <- c(1,2,3,4,5,6)
The operator <– is equivalent to "=" sign.
State <- c("DL", "MU", "NY", "DL", "NY", "MU")
To calculate frequency for State vector, you can use table function.
table(State)

To calculate mean for a vector, you can use mean function.
x <- c(1,2,3,NA,5,6)
mean(x)

Since the above vector contains a NA (not available) value, the mean function returns NA.
To calculate mean for a vector excluding NA values, you can include na.rm = TRUE parameter in mean function.
mean(x, na.rm=TRUE)

You can use square brackets [element_position] to access elements of a vector.
my_vector <- c(4,2,1,3,6,5)

my_vector[c(1,4)] # 1st and 4th position
# Output : 4 3

my_vector[2:4] # 2nd to 4th position
# Output : 2 1 3
x <- c(1,2,3,4,5,6)
sum(x[c(3,5)])

sum(x[c(3,5)]) returns the sum of the elements in x at positions 3 and 5.
R has a special data structure to store categorical variables. It tells R that a variable is nominal or ordinal by making it a factor.
gender <- c(1,2,1,2,1,2)
gender <- factor(gender)

The factor function has three parameters:
- Vector Name
- Values (Optional)
- Value labels (Optional)
gender <- c(1,2,1,2,1,2,1,2)
gender <- factor(gender,
                 levels = c(1,2),
                 labels = c("male","female"))
In this example, the 'gender' vector will be a factor with levels "male" and "female" and the numeric values 1 and 2 will be mapped to these levels.

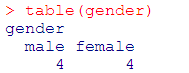
Now you will see the labels in the output generated by 'table()' function.
table(gender)
All values in columns in a matrix must have the same mode (numeric, character, etc.) and the same length.
The cbind() function joins columns together into a matrix. See the usage below -
x <- c(1,2,3,4,5)
y <- c(1,3,5,7,9)
z <- c(1,2,5,4,7)
mymatrix <- cbind(x,y,z)
mymatrix

You can also use the matrix() function for creating a matrix in R. The syntax of the matrix function is as follows:
matrix(data, nrow = ..., ncol = ...)
# Create a matrix with 3 rows and 2 columns
my_matrix <- matrix(1:6, nrow = 3, ncol = 2)
print(my_matrix)
To see dimension of the matrix, you can use dim() function.
dim(mymatrix)

To see correlation of the matrix, you can use cor() function.
cor(mymatrix)

You can use square brackets [row_position,column_position] to select specific rows or columns.
mymatrix[3,] # 3rd row of matrix
mymatrix[1,3] # 1st row of 3rd column
mymatrix[1:2,2:3] # rows 1,2 of columns 2nd and 3rd

The numbers to the left side in brackets are the row numbers. The form [1, ] means that it is row number one and the blank following the comma means that R has displayed all the columns.
Arrays are similar to matrices but can have more than two dimensions.
# Creating an array
my_array <- array(1:12, dim = c(2, 3, 4))  # 3D array with 2x3x4 dimensions
print(my_array)
, , 1

     [,1] [,2] [,3]
[1,]    1    3    5
[2,]    2    4    6

, , 2

     [,1] [,2] [,3]
[1,]    7    9   11
[2,]    8   10   12

, , 3

     [,1] [,2] [,3]
[1,]    1    3    5
[2,]    2    4    6

, , 4

     [,1] [,2] [,3]
[1,]    7    9   11
[2,]    8   10   12
A data frame is similar to SAS and SPSS datasets. It contains variables and records.
It is more general than a matrix, in that different columns can have different modes (numeric, character, factor etc.)
The data.frame() function is used to combine variables (vectors and factors) into a data frame.
x <- c(1,2,3,4,5)
y <- c(1,3,5,7,9)
z <- c(1,2,5,4,7)
gender <- c("m","f","m","m","f")
mydata <- data.frame(x,y,z,gender)

You can also specify the columns within the 'data.frame()' function.
mydata <- data.frame(x = c(1,2,3,4,5),
                     y = c(1,3,5,7,9),
                     z = c(1,2,5,4,7),
                     gender = c("m","f","m","m","f"))
To convert a column "x" to factor, you can use the function as.factor()
mydata$x = as.factor(mydata$x)
To convert a column "y" to character, you can use the function as.character()
mydata$y = as.character(mydata$y)
To convert a column "y" to numeric, you can use the function as.numeric()
mydata$y = as.numeric(mydata$y)
A list allows you to store a variety of objects.
mylist <- list(x,y,z,gender,mydata)
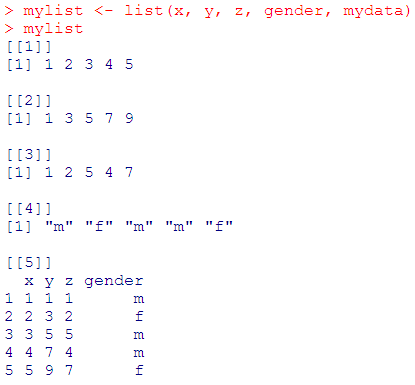
You can use the double square brackets [[n]] which can be used for extracting an element from the list. 'n' refers to the index of the element you want to extract.
mylist[[3]]

tibble is a modern version of a data frame. It's a part of tidyverse package. It is more efficient than data.frame().
# Creating a tibble having sample data
library(tibble)
my_tibble <- tibble(
  name = c("Dave", "Sandy", "Tim"),
  age = c(25, 30, 35)
)

print(my_tibble)
1. 'class' is a property assigned to an object that determines how generic functions operate with it. It is not a mutually exclusive classification.
class(mydata)
# [1] "data.frame"
2. 'mode' is a mutually exclusive classification of objects according to their basic structure. The 'atomic' modes are numeric, complex, charcter and logical.
> x <- 1:16
> x <- factor(x)
> class(x)
[1] "factor"
> mode(x)
[1] "numeric"

Deepanshu founded ListenData with a simple objective - Make analytics easy to understand and follow. He has over 10 years of experience in data science. During his tenure, he worked with global clients in various domains like Banking, Insurance, Private Equity, Telecom and HR.
Congrats, Mr. Bhalla. This post was very clear, straight and useful. Thanks for sharing it with us.
ReplyDeleteThank you for your appreciation. Glad you found it useful.
DeleteI agree with Prof. Luiz. It is the best tutorial I came across uptill now! Congrats... and heartfelt thanks!
Deletethank a lot !
ReplyDeletethank a lot !
ReplyDeleteCheers!
DeleteGreat and quick tutorials.
ReplyDeleteGlad you found it helpful. Cheers!
DeleteAwesome excllent bro...Thanks alot really Thanks..
ReplyDeleteExcellent Job Man !
ReplyDeletethis is really Awesome post Bro !!! If possible can you add some case studies will be really helpful to get some practical knowledge
ReplyDeleteThis is very useful who needs supports to stand..
ReplyDeleteThanku so much Please share practice exercises as well at the end of each session to practice
ReplyDeletegreat, easy to understand for user who is starting yet!
ReplyDeleteI have knowledge of R and looking for visulization of data sets, if have any specific link, request to you, please share it to me.
what is the correlation? can you please explain that part
ReplyDeleteSuperb.
ReplyDeleteGreat content. Loved it
ReplyDeleteSuch great content..
ReplyDeleteCould you please specify what's the difference between List and Array then?
Does an array cannot contain any of the things such as 'vectors', 'factors', etc?
Can vector be 2-dimensional?
Thanks!
Thanks a lot for this great R tutorial!
ReplyDeletegood
ReplyDeleteyour tutorial is very helpful to me . easy to understand . congratulations sir
ReplyDeleteHi, your resources are very useful and simple to understand.
ReplyDeletesimple and easy to understand.
ReplyDeleteabsolutely what i was looking for..thank you.
ReplyDeletevery simple to understand.
ReplyDelete