This tutorial explains multiple methods for deleting columns with missing values in R.
Let's create a sample dataframe.
# Create a sample dataframe
data <- data.frame(
  A = c(1, 2, NA, 4),
  B = c(NA, 2, 3, 4),
  C = c(1, NA, 3, NA),
  D = c(1, 2, 3, 4)
)
As you can see in the table below, there is only one column named "D" having no missing values at all.
| A | B | C | D | |
|---|---|---|---|---|
| 1 | 1 | NA | 1 | 1 |
| 2 | 2 | 2 | NA | 2 |
| 3 | NA | 3 | 3 | 3 |
| 4 | 4 | 4 | NA | 4 |
Method 1: Remove columns with missing values using base R
In this example, colSums(is.na(data)) calculates the sum of missing values for each column, and then colSums(is.na(data)) == 0 creates a logical vector indicating whether each column has no missing values. By using this logical vector to index the columns of the dataframe, you can remove the columns with missing values.
data_clean <- data[colSums(is.na(data)) == 0]
print(data_clean)
Method 2: Remove columns with missing values using dplyr package
The following code uses the select_if function from dplyr package which is used to select columns based on a condition. The ~ !any(is.na(.)) condition checks if there are no missing values in each column and selects only the columns that meet this condition.
library(dplyr)

# Remove columns with missing values using dplyr
data_clean <- data %>%
  select_if(~ !any(is.na(.)))

print(data_clean)
Remove Columns with More Than X% Missing Values in R
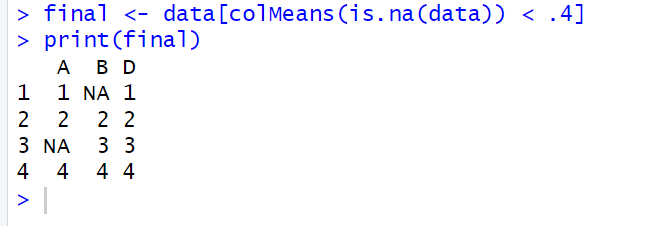
The following code removes columns from the "data" dataframe where more than 40% of the values are missing (NA). It returns columns A, B and D.
final <- data[colMeans(is.na(data)) < .4]
print(final)
is.na(data)returns a dataframe of the same dimensions asdata, but withTRUEvalues where there are missing values (NA) andFALSEwhere values are not missing.colMeans(is.na(data))calculates the proportion of missing values in each column by taking the mean of theTRUEvalues (which represent missing values) in each column.colMeans(is.na(data)) < .4generates a logical vector indicating for each column whether the proportion of missing values is less than 0.4 (40%).data[colMeans(is.na(data)) < .4]selects only those columns where the condition isTRUE, i.e., where less than 40% of the values are missing.
Remove Columns with More Than X% Missing Values in R using dplyr package
The following code uses the dplyr package to select columns from the data where the proportion of missing values (NA) is less than 0.4.
library(dplyr)
final <- data %>%
  select_if(~ mean(is.na(.)) < 0.4)
print(final)
~ mean(is.na(.)) < 0.4 is a lambda function applied to each column. It calculates the proportion of missing values in each column using mean(is.na(.)) and checks if it's less than 0.4.


Share Share Tweet