This tutorial explains how to use PROC FREQ with examples in SAS.
The PROC FREQ procedure is used to summarize categorical variables in SAS. It calculates count/frequency and cumulative frequency of categories of a categorical variable. It can also produce bar charts and tests for association between two categorical variables.
The program below creates a sample SAS dataset which will be used to explain examples in this tutorial.
data example1;
input x y $ z;
cards;
6 A 60
6 A 70
2 A 100
2 B 10
3 B 67
2 C 81
3 C 63
5 C 55
;
run;
The created dataset looks like below -
| X | Y | Z |
|---|---|---|
| 6 | A | 60 |
| 6 | A | 70 |
| 2 | A | 100 |
| 2 | B | 10 |
| 3 | B | 67 |
| 2 | C | 81 |
| 3 | C | 63 |
| 5 | C | 55 |
Suppose you want to see the frequency distribution of variable 'y'.
proc freq data = example1;
tables y;
run;
The TABLES statement tells SAS to return n-way frequency and cross-tabulation tables and computes the statistics for these tables.
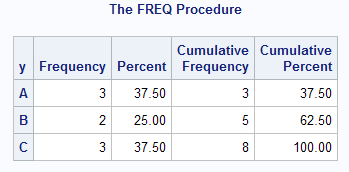
It answers a question 'which category holds the maximum number of cases'. In this case, the category 'C' contains maximum number of values.
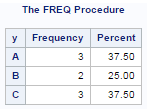
Suppose you do not want cumulative frequency and cumulative percent to be displayed in the table. The option NOCUM tells SAS to not to return cumulative scores.
proc freq data = example1;
tables y /nocum;
run;
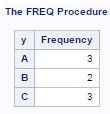
If you want only frequency, not percent distribution and cumulative statistics.
proc freq data = example1;
tables y /nopercent nocum;
run;
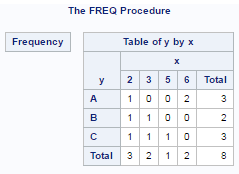
Suppose you want to see the distribution of variable 'y' by variable 'x'.
proc freq data = example1;
tables y * x;
run;
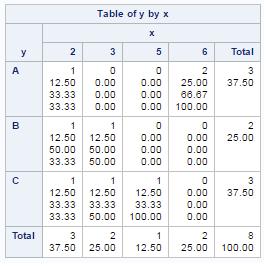
The output of the above SAS program is shown in the image above.
Suppose you do not want output to be shown in tabular form. Instead, you want final analysis to be displayed in list form (See the image below)
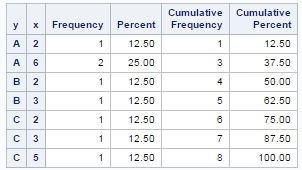
proc freq data = example1;
tables y * x / list;
run;
The forward slash followed by LIST keyword produces the list styled table.
proc freq data = example1;
tables y * x / norow nocol nopercent;
run;
The NOROW option hides row percentage in cross-tabulation. Similarly, NOCOL option suppresses column percentage.
Suppose you want to generate multiple crosstabs. To accomplish it, you can run the command below-
proc freq data = example1;
tables y * (x z) / norow nocol nopercent;
run;
The tables y*(x z) statement is equivalent to tables y*x y*z statement. In this case, it returns two tables - y by x and y by z.
Example - tables (a b)*(c d); is equivalent to tables a*c b*c a*d b*d;
The NLEVELS option is used to count number of unique values in a variable.
proc freq data = example1 nlevels;
tables y;
run;
In this case, it returns 3 for variable Y.
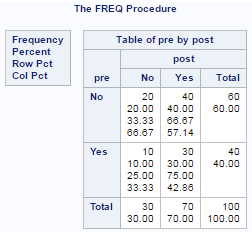
The WEIGHT statement is used when we already have the counts. It makes PROC FREQ use count data to produce frequency and cross-tabulation tables.
Data example2;
input pre $ post $ count;
cards;
Yes Yes 30
Yes No 10
No Yes 40
No No 20
;
run;
proc freq data=example2;
tables pre*post;
weight count;
run;
Suppose you wish to save the result in a SAS dataset instead of printing it in result window.
proc freq data = example1 noprint;
tables y *x / out = temp;
run;
The OUT option is used to store result in a data file. NOPRINT option prevents SAS to print it in results window.
The CHISQ option provides chi-square tests of homogeneity or independence and measures of association between two categorical variables. Also it helps to identify the statistically significant categorical variables that we should include in our predictive model. All the categorical variables with a chi-square value less than or equal to 0.05 are kept.
proc freq data = example1 noprint;
tables y * x/chisq;
output All out=temp_chi chisq;
run;
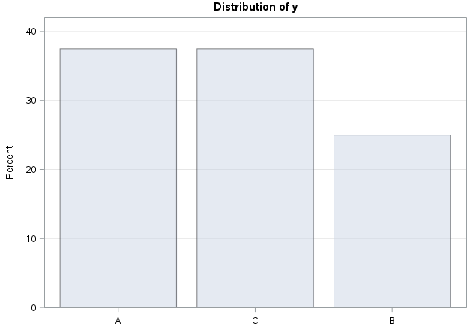
The bar chart can be generated with PROC FREQ. To produce a bar chart for variable 'y', the plots=freqplot (type=bar) option is added. By default, it shows frequency in graph. In order to show percent, you need to add scale=percent. The ODS graphics ON statement tells SAS to produce graphs. Later we turn it off.
Ods graphics on;
Proc freq data=example1 order=freq;
Tables y/ plots=freqplot (type=bar scale=percent);
Run;
Ods graphics off;
Similarly, we can produce dot plot by adding type=dot. See the implementation below-
Ods graphics on;
Proc freq data=example1 order=freq;
Tables y/ plots=freqplot (type=dot);
Run;
Ods graphics off;
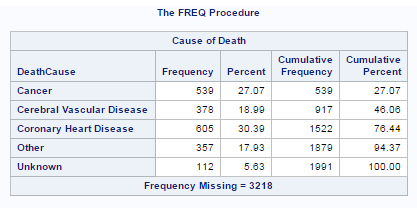
By default, PROC FREQ does not consider missing values while calculating percent and cumulative percent. The number of missing values are shown separately (below the table). Refer the image below.
Proc freq data=sashelp.heart;
Tables deathcause;
Run;
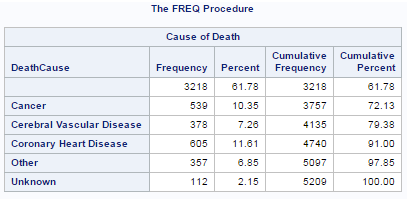
By adding MISSING option, it includes missing value as a separate category and all the respective statistics are generated based on it.
Proc freq data=sashelp.heart;
Tables deathcause / missing;
Run;
In PROC FREQ, the categories of a character variable are ordered alphabetically by default. For numeric variables, the categories are ordered from smallest to largest value.
To sort categories on descending order by frequency (from largest to smallest count), add ORDER=FREQ option.
Proc freq data=sashelp.heart order = FREQ;
Tables deathcause / missing;
Run;
It is generally advisable to show distribution of a nominal variable after sorting categories by frequency. For ordinal variable, it should be shown based on level of categories.
To order categories based on a particular FORMAT, you can use order = FORMATTED option.

Deepanshu founded ListenData with a simple objective - Make analytics easy to understand and follow. He has over 10 years of experience in data science. During his tenure, he worked with global clients in various domains like Banking, Insurance, Private Equity, Telecom and HR.
Good explaination!
ReplyDeleteThank you!
DeleteGreat tutorial...
ReplyDeletecould you also explain more on 'WEIGHT statement'
yes youre right? even i do not understand this syntax called 'weight';
DeleteGood work, Keep it up :)
ReplyDeleteGlad you liked it. Cheers!
DeleteGood question bank and explanations.Keep posting!!
DeleteSimply amazing...
ReplyDeletesuperb description
ReplyDeleteGood Work, luck to stumble upon your site.
ReplyDeleteAmazing tutorial. Keep up the good work!
ReplyDeleteAmazing description. You are really making it easy for SAS beginners :)
ReplyDeleteThank you for your effort and resources
how to use by statement in proc freq
ReplyDeleteBest...I learned alot
ReplyDeletethanks sir
ReplyDeleteGood presentation sir
ReplyDeleteHi Deepanshu,
ReplyDeleteWell explained. I have 1 query regarding ods file. We are using VM space and when we are trying to save the following error occured. Could you please help.
ods rtf file = "C:\Users\kiran\table1a.rtf" style = forNESUG;
WARNING: Style FORNESUG not found; Rtf style will be used instead.
ERROR: Insufficient authorization to access /opt/sasinside/SASConfig/Lev1/SASApp/C:\Users\kiran\table1a.rtf.
Excellent explanations. Really easy to understand SAS programming through your portal.
ReplyDeleteExcellent explanations. Really easy to understand SAS programming through your portal.
ReplyDeleteThanks
ReplyDeleteVery good!!
ReplyDeleteExcellent explanations. You make me the life easier.
ReplyDeleteThat is a very nice and well explained summary, thank you!
ReplyDeletethanks for excellent turorials. copy and pasted your code but not working..
ReplyDeleteproc freq data = example1 noprint;
tables y * x/chisq;
output All out=temp_chi chisq;
run;
Fantastic! Every one of the tutorials worked for me.
ReplyDeleteThank you very much.
Charles
Glad you found it helpful. Cheers!
DeleteThank you for you explanation. Very nice of you!
ReplyDeleteGreat, thanks
ReplyDeleteExellent explanation ! Thank You so much!
ReplyDeleteThis website is pure gold for newcomers like me who want to get into coding.
ReplyDeleteThank you so very much!!
Good work 👍
ReplyDeletewrite a program to get output using proc freq
ReplyDeleteX1 X2
N 19
M 10
F 9
write a program to get output using proc freq
ReplyDeleteX1 X2
N 19
M 10
F 9
Ans: I think we can create a new data set and run the proc freq. I pasted the code below I hope this is what you expecting please let me know.
data temp;
input x1 :$10. x2;
datalines;
N 19
M 10
F 9
;
run;
proc freq data= temp;
run;