I have created a user-defined function named tbl( ) for implementing bootstrap 4 classes with table. The function has four arguments which are as follows :
dataName of Data frame which you want to show in table.indexRow Number. Will be displayed as first column in the table. You need to create a column for serial number. It can have any string or font awesome classes likefas fa-star.namecolSecond column of the table. It can be any column wherein you want to show icons or images next to it.nameiconOptional Argument. Name of column which contains links of images.
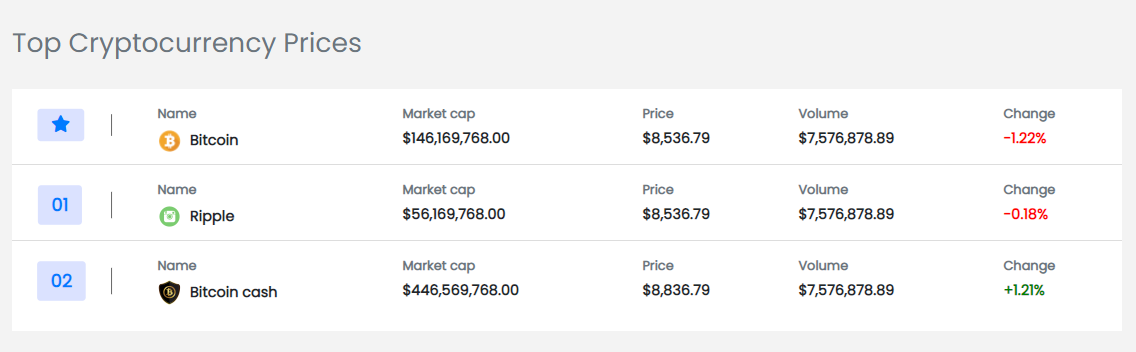
Sample Dataframe
df <- data.frame(
  col0 = c("fas fa-star", "01", "02"),
  nameicon = c("https://www.freepnglogos.com/uploads/bitcoin-png/bitcoin-all-about-bitcoins-9.png",
               "https://freepngimg.com/thumb/bitcoin/59549-cryptocurrency-money-bitcoin-gold-cash-free-photo-png-thumb.png",
               "https://freepngimg.com/thumb/bitcoin/59526-cryptocurrency-badge-bitcoin-gold-png-file-hd-thumb.png"),
  Name = c("Bitcoin", "Ripple", "Bitcoin cash"),
  `Market cap` = c("$146,169,768.00", "$56,169,768.00", "$446,569,768.00"),
  Price = c("$8,536.79", "$8,536.79", "$8,836.79"),
  Volume = c("$7,576,878.89", "$7,576,878.89", "$7,576,878.89"),
  Change = c("-1.22%", "-0.18%", "+1.21%"),
  check.names = FALSE
)
In the program below we are using tbl(df, col0, Name, nameicon)
library(shiny)
library(dplyr)

tbl <- function(data, index, namecol, nameicon = NULL)  {

  temp <- list()
  index <- deparse(substitute(index))
  namecol <- deparse(substitute(namecol))

  if(!missing(nameicon)) {
    nameicon <- deparse(substitute(nameicon))
  }

  # Convert to Character
  col_names <- names(data)
  data[,col_names] <- lapply(data[,col_names] , as.character)

  # Loop over Rows
  for(i in 1:nrow(data)) {

    col0 = data[i,index]
    col1 = data[i,namecol]
    icon = data[i,nameicon]

    first2cols <-  list(

      tags$td(tags$div(
        class = "d-flex mt-2 border-right",
        tags$div(
          class = "box p-2 rounded",
          tags$span(
            class = ifelse(substr(col0,1,2)=="fa", paste(col0, "fa-lg text-primary px-2"),
                           "text-primary px-2 font-weight-bold"),
            ifelse(substr(col0,1,2)=="fa", '', col0)
          )
        )
      )),
      tags$td(tags$div(
        class = "d-flex flex-column",
        tags$div(
          class = "text-muted",
          namecol
        ),
        if(!is.null(nameicon)) {
          tags$div(
            class = "d-flex align-items-center",
            tags$div(tags$img(
              src = icon,
              alt = NA,
              class = "icons"
            )),
            tags$b(
              class = "pl-2",
              col1
            )
          ) } else {

            tags$div(
              tags$b(
                col1
              )
            )
          }
      ))

    )

    # Loop over Columns (ignoring index, name and icon columns)
    temp.col <- list()
    data2 <- data[!(names(data) %in% c(index, namecol, nameicon))]
    for(j in 1:ncol(data2)) {

      temp.col[[j]] <-
        tags$td(tags$div(
          class = "d-flex flex-column",
          tags$div(
            class = "text-muted",
            colnames(data2)[j]
          ),
          tags$div(tags$b(data2[i,j]))
        ))

    }
    temp[[i]] <- tags$tr(first2cols, temp.col)

  }

  tags$div(
    class = "bg-white table-responsive",
    tags$table(
      class = "table",
      tags$tbody(
        temp
      ))
  )

}


# Bootstrap 4
theme <- bslib::bs_theme(version = 4)

# UI
ui <- fluidPage(

  theme = theme,

  br(),

  htmltools::htmlDependency(name = "font-awesome",
                            version = "5.13.0",
                            src = "www/shared/fontawesome",
                            package = "shiny",
                            stylesheet = c("css/all.min.css", "css/v4-shims.min.css")),

  tags$style("@import url('https://fonts.googleapis.com/css2?family=Poppins&display=swap');

* {
    padding: 0;
    margin: 0;
    box-sizing: border-box;
    font-family: 'Poppins', sans-serif;
    font-size: 0.95rem
}

body {
    background-color: #f3f3f3
}

#starred {
    box-shadow: 3px 3px 10px #b5b5b5
}

.table div.text-muted {
    font-size: 0.85rem;
    font-weight: 600;
    margin-bottom: 0.3rem;
    margin-top: 0.3rem
}

.icons {
    object-fit: contain;
    width: 25px;
    height: 25px;
    border-radius: 50%
}

.graph img {
    object-fit: contain;
    width: 40px;
    height: 50px;
    transform: scale(2) rotateY(45deg)
}

.graph .dot {
    width: 12px;
    height: 12px;
    border-radius: 50%;
    border: 3px solid #fff;
    position: absolute;
    background-color: blue;
    box-shadow: 1px 1px 1px #a5a5a5;
    top: 25px
}

.graph .dot:after {
    background-color: #fff;
    content: '$9,999.00';
    font-weight: 600;
    font-size: 0.7rem;
    position: absolute;
    top: -25px;
    left: -20px;
    box-shadow: 1px 1px 2px #a5a5a5;
    border-radius: 2px
}

.font-weight-bold {
    font-size: 1.3rem
}

#ethereum {
    transform: scale(2) rotateY(45deg) rotateX(180deg)
}

#ripple {
    transform: scale(2) rotateY(10deg) rotateX(20deg)
}

#eos {
    transform: scale(2) rotateY(50deg) rotateX(190deg)
}

.table tr td {
    border: none
}

.red {
    color: #ff2f2f;
    font-weight: 700
}

.green {
    color: #1cbb1c;
    font-weight: 700
}

.labels,
.graph {
    position: relative
}

.green-label {
    background-color: #00b300;
    color: #fff;
    font-weight: 600;
    font-size: 0.7rem
}

.orange-label {
    background-color: #ffa500;
    color: #fff;
    font-weight: 600;
    font-size: 0.7rem
}

.border-right {
    transform: scale(0.6);
    border-right: 1px solid black !important
}

.box {
    transform: scale(1.5);
    background-color: #dbe2ff
}

#top .table tbody tr {
    border-bottom: 1px solid #ddd
}

#top .table tbody tr:last-child {
    border: none
}

select {
    background-color: inherit;
    padding: 8px;
    border-radius: 5px;
    color: #444;
    border: 1px solid #444;
    outline-color: #00f
}

.text-white {
    background-color: rgb(43, 159, 226);
    border-radius: 50%;
    font-size: 0.7rem;
    font-weight: 700;
    padding: 2px 3px
}

a:hover {
    text-decoration: none
}

a:hover .text-white {
    background-color: rgb(20, 92, 187)
}

::-webkit-scrollbar {
    width: 10px;
    height: 4px
}

::-webkit-scrollbar-thumb {
    background: linear-gradient(45deg, #999, #777);
    border-radius: 10px
}

@media(max-width:379px) {
    .d-lg-flex .h3 {
        font-size: 1.4rem
    }
}

@media(max-width:352px) {
    #plat {
        margin-top: 10px
    }
}"),


  fluidRow(

    tags$div(
      class = "container mt-5",
      tags$div(
        class = "d-lg-flex align-items-lg-center py-4",
        tags$div(
          class = "h3 text-muted",
          "Top Cryptocurrency Prices"
        )
      ),
      tags$div(
        id = "top",
        tbl(df, col0, Name, nameicon)
      )
    ))
)


# Server
server <- function(input, output, session) { }

# Run App
shinyApp(ui = ui, server = server)
Conditional Formatting
To color negative and positive signs in `change` column separately, we can use javascript for conditionally formatting. In the code below we are formatting 6th column td:nth-child(6). You can change it as per your dataframe.
jscode <- "var CONTROL_INTERVAL2 = setInterval(function(){

    $('table tbody td:nth-child(6) b').each(function() {
      const value = $(this).text().substr(0,1);
      if ( value == '-') {
        $(this).css('color', 'red');
      }
      else {
        $(this).css('color', 'green');
      }

    });

    clearInterval(CONTROL_INTERVAL2);

  }, 500);"
See the complete code below
theme <- bslib::bs_theme(version = 4)

# UI
ui <- fluidPage(

  theme = theme,

  br(),

  htmltools::htmlDependency(name = "font-awesome",
                            version = "5.13.0",
                            src = "www/shared/fontawesome",
                            package = "shiny",
                            stylesheet = c("css/all.min.css", "css/v4-shims.min.css")),


  tags$script("

      Shiny.addCustomMessageHandler('closeWindow', function(data) {
        eval(data.message)
      });"
  ),

  tags$style("@import url('https://fonts.googleapis.com/css2?family=Poppins&display=swap');

* {
    padding: 0;
    margin: 0;
    box-sizing: border-box;
    font-family: 'Poppins', sans-serif;
    font-size: 0.95rem
}

body {
    background-color: #f3f3f3
}

#starred {
    box-shadow: 3px 3px 10px #b5b5b5
}

.table div.text-muted {
    font-size: 0.85rem;
    font-weight: 600;
    margin-bottom: 0.3rem;
    margin-top: 0.3rem
}

.icons {
    object-fit: contain;
    width: 25px;
    height: 25px;
    border-radius: 50%
}

.graph img {
    object-fit: contain;
    width: 40px;
    height: 50px;
    transform: scale(2) rotateY(45deg)
}

.graph .dot {
    width: 12px;
    height: 12px;
    border-radius: 50%;
    border: 3px solid #fff;
    position: absolute;
    background-color: blue;
    box-shadow: 1px 1px 1px #a5a5a5;
    top: 25px
}

.graph .dot:after {
    background-color: #fff;
    content: '$9,999.00';
    font-weight: 600;
    font-size: 0.7rem;
    position: absolute;
    top: -25px;
    left: -20px;
    box-shadow: 1px 1px 2px #a5a5a5;
    border-radius: 2px
}

.font-weight-bold {
    font-size: 1.3rem
}

#ethereum {
    transform: scale(2) rotateY(45deg) rotateX(180deg)
}

#ripple {
    transform: scale(2) rotateY(10deg) rotateX(20deg)
}

#eos {
    transform: scale(2) rotateY(50deg) rotateX(190deg)
}

.table tr td {
    border: none
}

.red {
    color: #ff2f2f;
    font-weight: 700
}

.green {
    color: #1cbb1c;
    font-weight: 700
}

.labels,
.graph {
    position: relative
}

.green-label {
    background-color: #00b300;
    color: #fff;
    font-weight: 600;
    font-size: 0.7rem
}

.orange-label {
    background-color: #ffa500;
    color: #fff;
    font-weight: 600;
    font-size: 0.7rem
}

.border-right {
    transform: scale(0.6);
    border-right: 1px solid black !important
}

.box {
    transform: scale(1.5);
    background-color: #dbe2ff
}

#top .table tbody tr {
    border-bottom: 1px solid #ddd
}

#top .table tbody tr:last-child {
    border: none
}

select {
    background-color: inherit;
    padding: 8px;
    border-radius: 5px;
    color: #444;
    border: 1px solid #444;
    outline-color: #00f
}

.text-white {
    background-color: rgb(43, 159, 226);
    border-radius: 50%;
    font-size: 0.7rem;
    font-weight: 700;
    padding: 2px 3px
}

a:hover {
    text-decoration: none
}

a:hover .text-white {
    background-color: rgb(20, 92, 187)
}

::-webkit-scrollbar {
    width: 10px;
    height: 4px
}

::-webkit-scrollbar-thumb {
    background: linear-gradient(45deg, #999, #777);
    border-radius: 10px
}

@media(max-width:379px) {
    .d-lg-flex .h3 {
        font-size: 1.4rem
    }
}

@media(max-width:352px) {
    #plat {
        margin-top: 10px
    }
}"),


  fluidRow(

    tags$div(
      class = "container mt-5",
      tags$div(
        class = "d-lg-flex align-items-lg-center py-4",
        tags$div(
          class = "h3 text-muted",
          "Top Cryptocurrency Prices"
        )
      ),
      tags$div(
        id = "top",
        tbl(df, col0, Name, nameicon)
      )
    ))
)


# Server
server <- function(input, output, session) {

  session$sendCustomMessage(type = "closeWindow", list(message = jscode))

}

# Run App
shinyApp(ui = ui, server = server)
Run Table in Server
Generally we need to pass reactive dataframe to table. Hence it is critical to run table in server section of the shiny app code. We can accomplish this using renderUI( ) and uiOutput( ) . See the demonstration below.
library(shiny)
library(dplyr)

df <- data.frame(
    col0 = c("fas fa-star", "01", "02"),
    nameicon = c("https://www.freepnglogos.com/uploads/bitcoin-png/bitcoin-all-about-bitcoins-9.png",
                 "https://freepngimg.com/thumb/bitcoin/59549-cryptocurrency-money-bitcoin-gold-cash-free-photo-png-thumb.png",
                 "https://freepngimg.com/thumb/bitcoin/59526-cryptocurrency-badge-bitcoin-gold-png-file-hd-thumb.png"),
    Name = c("Bitcoin", "Ripple", "Bitcoin cash"),
    `Market cap` = c("$146,169,768.00", "$56,169,768.00", "$446,569,768.00"),
    Price = c("$8,536.79", "$8,536.79", "$8,836.79"),
    Volume = c("$7,576,878.89", "$7,576,878.89", "$7,576,878.89"),
    Change = c("-1.22%", "-0.18%", "+1.21%"),
    check.names = FALSE
    )

jscode <- "var CONTROL_INTERVAL2 = setInterval(function(){

    $('#mytable table tbody td:nth-child(6) b').each(function() {
      const value = $(this).text().substr(0,1);
      if ( value == '-') {
        $(this).css('color', 'red');
      }
      else {
        $(this).css('color', 'green');
      }

    });

    clearInterval(CONTROL_INTERVAL2);

  }, 500);"


tbl <- function(data, index, namecol, nameicon = NULL)  {

temp <- list()
index <- deparse(substitute(index))
namecol <- deparse(substitute(namecol))

if(!missing(nameicon)) {
  nameicon <- deparse(substitute(nameicon))
}

# Convert to Character
col_names <- names(data)
data[,col_names] <- lapply(data[,col_names] , as.character)

# Loop over Rows
for(i in 1:nrow(data)) {

  col0 = data[i,index]
  col1 = data[i,namecol]
  icon = data[i,nameicon]

  first2cols <-  list(

    tags$td(tags$div(
      class = "d-flex mt-2 border-right",
      tags$div(
        class = "box p-2 rounded",
        tags$span(
          class = ifelse(substr(col0,1,2)=="fa", paste(col0, "fa-lg text-primary px-2"),
                         "text-primary px-2 font-weight-bold"),
          ifelse(substr(col0,1,2)=="fa", '', col0)
        )
      )
    )),
    tags$td(tags$div(
      class = "d-flex flex-column",
      tags$div(
        class = "text-muted",
        namecol
      ),
      if(!is.null(nameicon)) {
      tags$div(
        class = "d-flex align-items-center",
        tags$div(tags$img(
          src = icon,
          alt = NA,
          class = "icons"
        )),
        tags$b(
          class = "pl-2",
          col1
        )
      ) } else {

        tags$div(
          tags$b(
            col1
          )
        )
      }
    ))

    )

    # Loop over Columns (ignoring index, name and icon columns)
    temp.col <- list()
    data2 <- data[!(names(data) %in% c(index, namecol, nameicon))]
    for(j in 1:ncol(data2)) {

      temp.col[[j]] <-
      tags$td(tags$div(
      class = "d-flex flex-column",
      tags$div(
        class = "text-muted",
        colnames(data2)[j]
      ),
      tags$div(tags$b(data2[i,j]))
    ))

    }
    temp[[i]] <- tags$tr(first2cols, temp.col)

}

tags$div(
  class = "bg-white table-responsive",
  tags$table(
    class = "table",
    tags$tbody(
      temp
    ))
  )

}


# Bootstrap 4
theme <- bslib::bs_theme(version = 4)

# UI
ui <- fluidPage(

  theme = theme,

  br(),

  htmltools::htmlDependency(name = "font-awesome",
                            version = "5.13.0",
                            src = "www/shared/fontawesome",
                            package = "shiny",
                            stylesheet = c("css/all.min.css", "css/v4-shims.min.css")),


  tags$script("

      Shiny.addCustomMessageHandler('closeWindow', function(data) {
        eval(data.message)
      });"
  ),

  tags$style("@import url('https://fonts.googleapis.com/css2?family=Poppins&display=swap');

* {
    padding: 0;
    margin: 0;
    box-sizing: border-box;
    font-family: 'Poppins', sans-serif;
    font-size: 0.95rem
}

body {
    background-color: #f3f3f3
}

#starred {
    box-shadow: 3px 3px 10px #b5b5b5
}

.table div.text-muted {
    font-size: 0.85rem;
    font-weight: 600;
    margin-bottom: 0.3rem;
    margin-top: 0.3rem
}

.icons {
    object-fit: contain;
    width: 25px;
    height: 25px;
    border-radius: 50%
}

.graph img {
    object-fit: contain;
    width: 40px;
    height: 50px;
    transform: scale(2) rotateY(45deg)
}

.graph .dot {
    width: 12px;
    height: 12px;
    border-radius: 50%;
    border: 3px solid #fff;
    position: absolute;
    background-color: blue;
    box-shadow: 1px 1px 1px #a5a5a5;
    top: 25px
}

.graph .dot:after {
    background-color: #fff;
    content: '$9,999.00';
    font-weight: 600;
    font-size: 0.7rem;
    position: absolute;
    top: -25px;
    left: -20px;
    box-shadow: 1px 1px 2px #a5a5a5;
    border-radius: 2px
}

.font-weight-bold {
    font-size: 1.3rem
}

#ethereum {
    transform: scale(2) rotateY(45deg) rotateX(180deg)
}

#ripple {
    transform: scale(2) rotateY(10deg) rotateX(20deg)
}

#eos {
    transform: scale(2) rotateY(50deg) rotateX(190deg)
}

.table tr td {
    border: none
}

.red {
    color: #ff2f2f;
    font-weight: 700
}

.green {
    color: #1cbb1c;
    font-weight: 700
}

.labels,
.graph {
    position: relative
}

.green-label {
    background-color: #00b300;
    color: #fff;
    font-weight: 600;
    font-size: 0.7rem
}

.orange-label {
    background-color: #ffa500;
    color: #fff;
    font-weight: 600;
    font-size: 0.7rem
}

.border-right {
    transform: scale(0.6);
    border-right: 1px solid black !important
}

.box {
    transform: scale(1.5);
    background-color: #dbe2ff
}

#top .table tbody tr {
    border-bottom: 1px solid #ddd
}

#top .table tbody tr:last-child {
    border: none
}

select {
    background-color: inherit;
    padding: 8px;
    border-radius: 5px;
    color: #444;
    border: 1px solid #444;
    outline-color: #00f
}

.text-white {
    background-color: rgb(43, 159, 226);
    border-radius: 50%;
    font-size: 0.7rem;
    font-weight: 700;
    padding: 2px 3px
}

a:hover {
    text-decoration: none
}

a:hover .text-white {
    background-color: rgb(20, 92, 187)
}

::-webkit-scrollbar {
    width: 10px;
    height: 4px
}

::-webkit-scrollbar-thumb {
    background: linear-gradient(45deg, #999, #777);
    border-radius: 10px
}

@media(max-width:379px) {
    .d-lg-flex .h3 {
        font-size: 1.4rem
    }
}

@media(max-width:352px) {
    #plat {
        margin-top: 10px
    }
}"),


  fluidRow(

    tags$div(
      class = "container mt-5",
      tags$div(
        class = "d-lg-flex align-items-lg-center py-4",
        tags$div(
          class = "h3 text-muted",
          "Top Cryptocurrency Prices"
        )
      ),
      tags$div(
        id = "top",
        uiOutput('mytable')
        )
      ))
  )


# Server
server <- function(input, output, session) {

  output$mytable <- renderUI({

    tbl(df, col0, Name, nameicon)

  })


  session$sendCustomMessage(type = "closeWindow", list(message = jscode))

  }

# Run App
shinyApp(ui = ui, server = server)

Deepanshu founded ListenData with a simple objective - Make analytics easy to understand and follow. He has over 10 years of experience in data science. During his tenure, he worked with global clients in various domains like Banking, Insurance, Private Equity, Telecom and HR.
Share Share Tweet