In this tutorial, we will show you how to calculate a correlation matrix using PROC CORR in SAS. We will also provide examples to help you understand the concept better. Correlation analysis measures the relationships between different variables in our data.
Calculate Pearson Correlation in SAS
The Pearson correlation measures the linear relationship between two continuous variables. It is also known as pearson correlation coefficient.
The pearson correlation coefficient lies between -1 and 1.
- A pearson correlation of +1 indicates a perfect positive linear relationship between the variables. This means that when one variable increases, the other also increases proportionally.
- A pearson correlation of -1 indicates a perfect negative linear relationship between the variables. This means that when one variable increases, the other decreases proportionally.
- A pearson correlation of 0 indicates no linear relationship between the variables.
By default, PROC CORR in SAS produces the Pearson correlation coefficient. The following code utilizes the PROC CORR procedure to calculate the correlation matrix, specifically the Pearson correlation coefficients, for the variables sepallength, sepalwidth, petallength, and petalwidth in the sashelp.iris dataset.
proc corr data=sashelp.iris;
var sepallength sepalwidth petallength petalwidth;
run;

PROC CORR produces two tables. The first table shows summary statistics for the variables. The second table is a correlation matrix that shows the Pearson correlation coefficients for all pairs of the specified variables in the dataset. It also includes a p-value that says whether the correlation is statistically significant.
The pearson correlation coefficient between SepalLength and PetalWidth is 0.81794 which means there is a strong positive linear relationship between them and the correlation is also statistically significant since the p-value is less than 0.05.
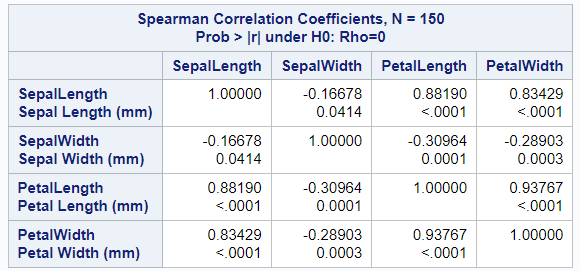
Calculate Spearman Correlation in SAS
The Spearman correlation measures the monotonic relationship between two variables. Unlike the Pearson correlation, which measures linear relationships between continuous variables, the Spearman correlation measures the monotonic relationship between two variables, which may be nonlinear.
It is useful when dealing with ordinal data or when the relationship between variables is not strictly linear. It is less sensitive to outliers than the Pearson correlation and can be applied to both continuous and discrete data.
The spearman correlation coefficient lies between -1 and 1.
- A spearman correlation of +1 indicates a perfect positive monotonic relationship. This means that as one variable increases, the other also increases, and vice versa. It forms a monotonic increasing shape on a scatter plot.
- A spearman correlation of -1 indicates a perfect negative monotonic relationship. This means that as one variable increases, the other decreases, and vice versa. It forms a monotonic decreasing shape on a scatter plot.
- A spearman correlation of 0 indicates no monotonic relationship between the variables.
The spearman option tells SAS to calculate the Spearman correlation coefficients instead of the default Pearson correlation coefficients. The following code uses the PROC CORR procedure to calculate the spearman correlation coefficients for the variables sepallength, sepalwidth, petallength, and petalwidth in the sashelp.iris dataset.
proc corr data=sashelp.iris spearman;
var sepallength sepalwidth petallength petalwidth;
run;
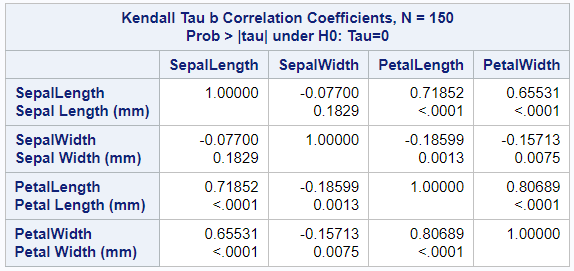
Calculate Kendall Rank Correlation Coefficient in SAS
The Kendall's rank correlation coefficient, also known as Kendall's tau-b coefficient, measures the association between two variables. Similar to Spearman's rank correlation, Kendall's tau-b is a non-parametric method, meaning it does not assume any particular distribution of the data and is suitable for both continuous and discrete variables.
Kendall's tau-b is often used when dealing with ranked or ordinal data and is less sensitive to ties (data points with the same value) compared to Spearman's rank correlation. It can be used for both ordinal and continuous variables.
The Kendall's tau-b lies between -1 and 1.
- A kendall rank correlation coefficient of +1 indicates a perfect positive association, meaning that all pairs of data points are concordant. When one variable increases, the other also increases, and vice versa.
- A kendall rank correlation coefficient of -1 indicates a perfect negative association, meaning that all pairs of data points are discordant. When one variable increases, the other decreases, and vice versa.
- A kendall rank correlation coefficient of 0 indicates no association between the variables. The number of concordant and discordant pairs is equal, indicating no consistent pattern in the relationship between the variables.
The kendall option tells SAS to calculate the Kendall tau-b correlation coefficients.
proc corr data=sashelp.iris kendall;
var sepallength sepalwidth petallength petalwidth;
run;
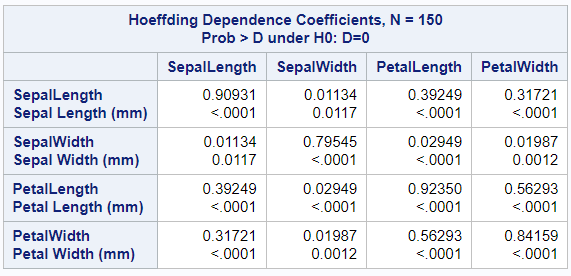
Calculate Hoeffding Dependence Coefficient in SAS
Hoeffding's measure of dependence, D is a measure of linear, monotonic and non-monotonic relationship. It has values between –0.5 to 1. The signs of Hoeffding coefficient has no interpretation.
The hoeffding option tells SAS to compute the Hoeffding Dependence Coefficient.
proc corr data=sashelp.iris hoeffding;
var sepallength sepalwidth petallength petalwidth;
run;
Calculate Correlation Between All Variables in SAS
When you omit the VAR statement in PROC CORR, it produces correlation coefficient for all the numeric variables in a dataset.
proc corr data=sashelp.iris;
run;
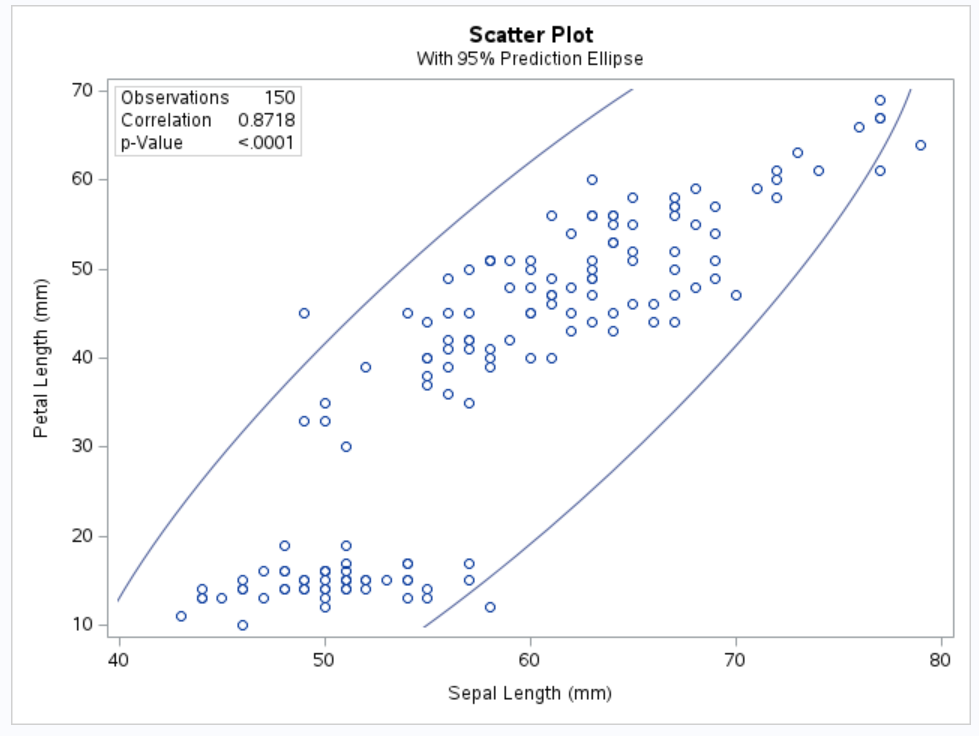
How to Visualize Correlation in SAS
The plots=scatter(nvar=all) tells SAS to generate scatter plots to show the relationship between all the variables specified in the VAR statement.
proc corr data=sashelp.iris plots=scatter(nvar=all);
var sepallength sepalwidth petallength petalwidth;
run;
If you want to see all the scatter plots in a single graph, you can use the plots=matrix(HISTOGRAM) option
proc corr data=sashelp.iris plots=matrix(HISTOGRAM);
var sepallength sepalwidth petallength petalwidth;
run;
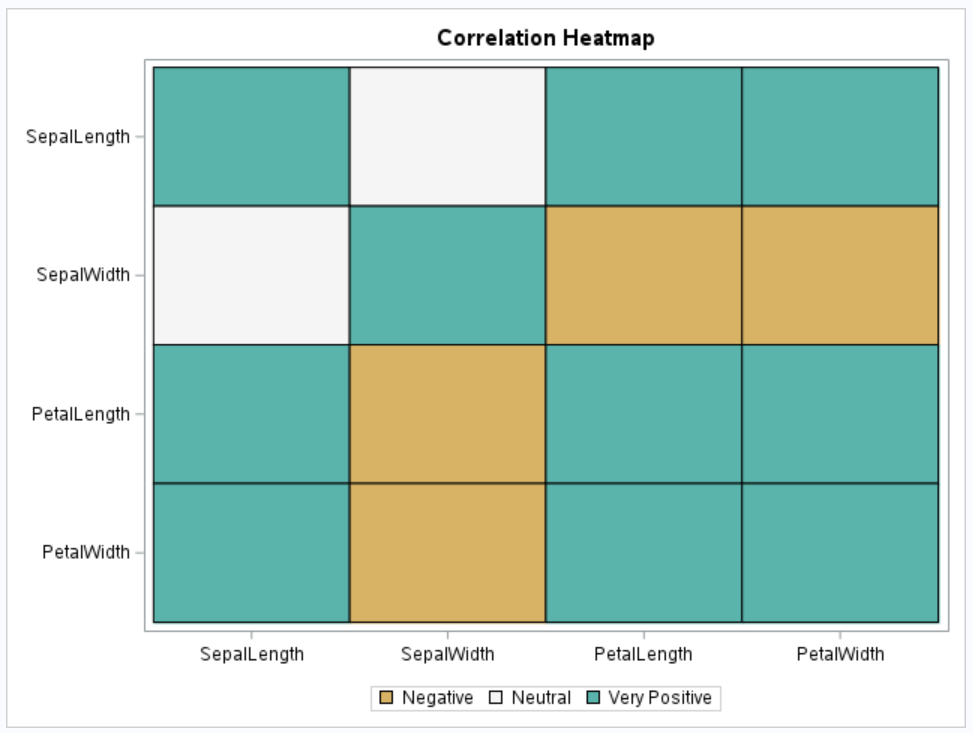
To create a heat map of correlation matrix, you can use the HEATMAPDISC subroutine of the PROC IML that displays a heat map of a matrix.
proc iml;
use sashelp.iris;
read all var _NUM_ into Y[c=varNames];
close sashelp.iris;
corr = corr(Y);
Bins = {"Very Negative", "Negative", "Neutral", "Positive", "Very Positive"};
idx = bin(corr, {-1, -0.7, -0.2, 0.2, 0.7, 1});
disCorr = shape(Bins[idx], nrow(corr));
call HeatmapDisc(disCorr) title="Correlation Heatmap" xvalues=varNames yvalues=varNames;
quit;
How to Hide P-Value in Correlation Table
The NOPROB option in PROC CORR tells SAS not to display the p-value associated with each correlation coefficient.
proc corr data=sashelp.iris spearman noprob;
var sepallength sepalwidth petallength petalwidth;
run;
How to Save Correlation Matrix in SAS
By using the ODS OUTPUT statement, we can store the correlation matrix in a dataset. The following code saves the output of the correlation analysis to a dataset named CorrData with the Pearson correlation coefficients.
ods output PearsonCorr  = CorrData;
proc corr data=sashelp.iris;
var sepallength sepalwidth petallength petalwidth;
run;
The following are the SAS table names that store different types of correlation.
PearsonCorr, SpearmanCorr, KendallCorr, or HoeffdingCorr
For example, the following code saves the output of spearman correlation coefficients to a dataset.
ods output SpearmanCorr  = CorrData;
proc corr data=sashelp.iris spearman;
var sepallength sepalwidth petallength petalwidth;
run;
How to Show Correlation in List Format in SAS
To show correlation in a list format instead of the correlation matrix format, you can specify the FISHER option along with the PEARSON option.
ods output fisherpearsoncorr  = PearsonCorrs;
proc corr data=sashelp.iris fisher pearson;
run;

Deepanshu founded ListenData with a simple objective - Make analytics easy to understand and follow. He has over 10 years of experience in data science. During his tenure, he worked with global clients in various domains like Banking, Insurance, Private Equity, Telecom and HR.
Share Share Tweet