In this tutorial, we will cover how to create a box plot in SAS, along with examples.
What is Box Plot?
A box plot is a graphical representation of a dataset that provides a summary of the distribution of a continuous variable. It shows first quartile (Q1), median (Q2), third quartile (Q3), and outliers (if any).

The basic syntax for creating a box plot in SAS is as follows.
proc sgplot data=dataset-name;
vbox continuous-variable;
run;
The VBOX statement tells SAS that you want to create a vertical box plot.
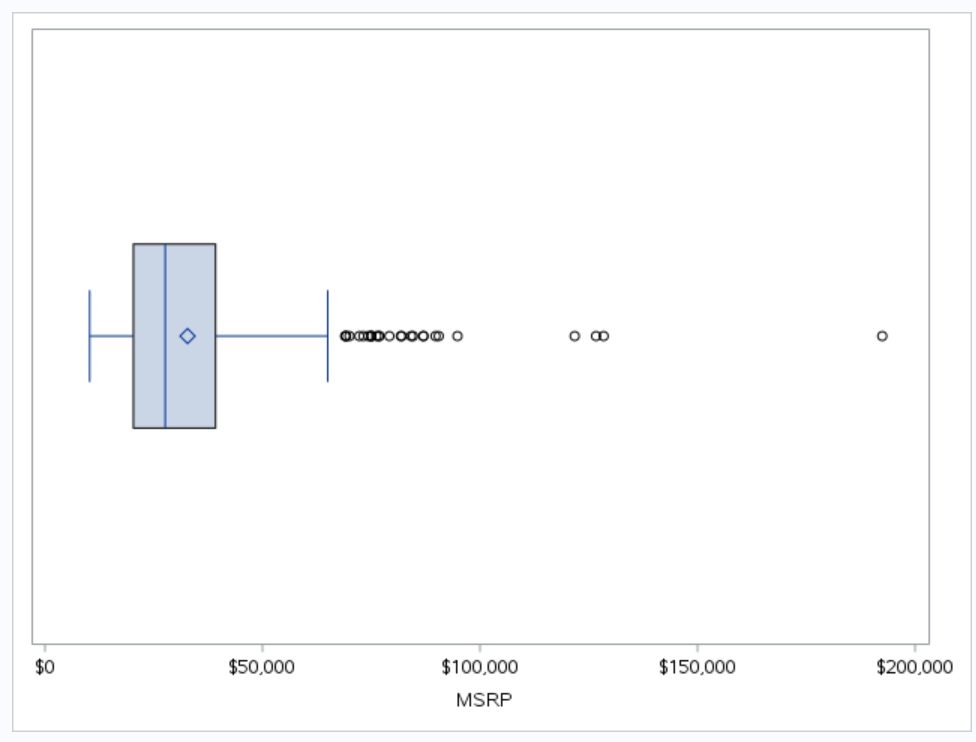
The following code uses the SGPLOT procedure in SAS to create a box plot for the variable "msrp" in the "sashelp.cars" dataset.
proc sgplot data=sashelp.cars;
vbox msrp;
run;
If you want to create a horizontal box plot, you can use the HBOX statement.
proc sgplot data=sashelp.cars;
hbox msrp;
run;
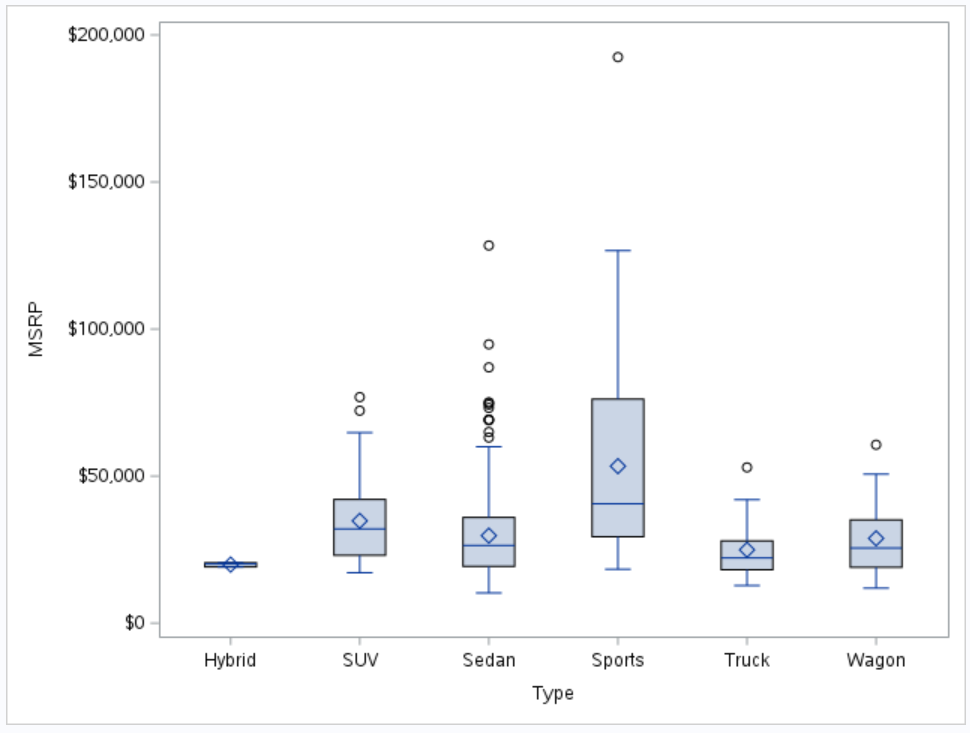
How to Create Box Plot by Categories
To create a box plot by distinct categories, you can use the CATEGORY= option in VBOX statement. The following code creates a box plot for the variable "msrp" by unique categories of the categorical variable named "type" in the "sashelp.cars" dataset.
proc sgplot data=sashelp.cars;
vbox msrp / category=type;
run;
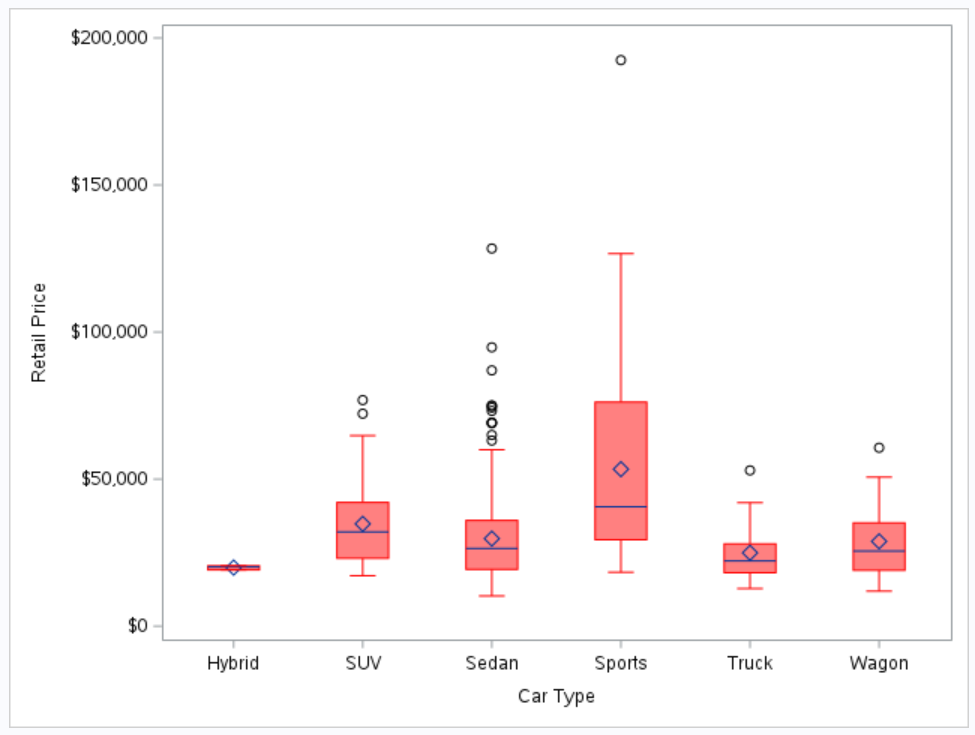
How to Style Box Plot in SAS
FILLATTRSoption sets the fill color of the boxes to red with a transparency of 0.5.LINEATTRSoption sets the color of the lines around the boxes to red.WHISKERATTRSoption sets the color of the whiskers (lines that extend from the boxes) to red.- The
LABEL=option in thexaxisandyaxisstatements specify the labels for the x-axis and y-axis of the plot.
proc sgplot data=sashelp.cars;
vbox msrp / category=type fillattrs=(color=red transparency=0.5) LINEATTRS=(color=red) WHISKERATTRS=(color=red);
xaxis label="Car Type";
yaxis label="Retail Price";
run;

Deepanshu founded ListenData with a simple objective - Make analytics easy to understand and follow. He has over 10 years of experience in data science. During his tenure, he worked with global clients in various domains like Banking, Insurance, Private Equity, Telecom and HR.
Share Share Tweet