In this tutorial, we will cover how to use PROC REPORT in SAS, along with examples.
PROC REPORT is a powerful SAS procedure used for creating highly customizable tabular reports. It also allows you to summarize, analyze and present data in a structured format.
The basic syntax of PROC REPORT is as follows :
proc report data=dataset-name;
column variable1 variable2 variable3;
run;
- data=dataset-name: Specify the dataset that contains the data you want to include in the report.
- column: Specify the order and variables to be shown in the report.
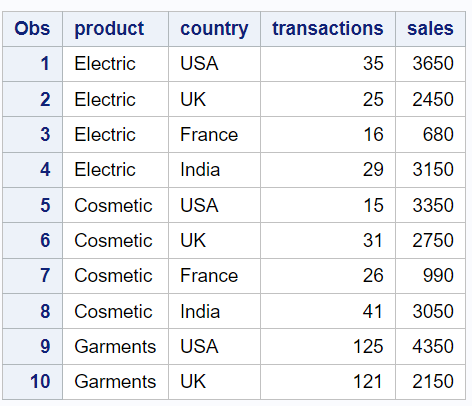
Let's create a sample dataset for the examples in this tutorial.
data mydata;
input product$ country$ transactions country;
cards;
Electric USA 35 3650
Electric UK 25 2450
Electric France 16 680
Electric India 29 3150
Cosmetic USA 15 3350
Cosmetic UK 31 2750
Cosmetic France 26 990
Cosmetic India 41 3050
Garments USA 125 4350
Garments UK 121 2150
;
run;
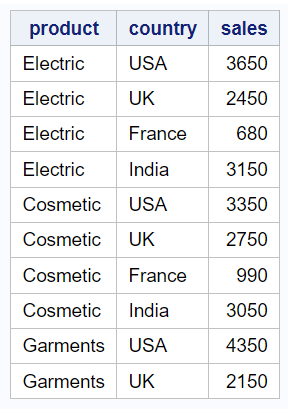
The basic syntax of PROC REPORT prints data like PROC PRINT procedure. In the code below, we are using the PROC REPORT procedure to create a tabular report with three columns: "product", "country" and "sales"
proc report data=mydata;
column product country sales;
run;
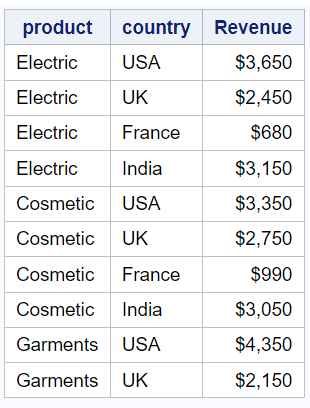
You can change the headers of the columns using the display option in the define statement. This will change how the column names appear in the report without modifying the actual variable names. In this example, "Revenue" is the new header label assigning to the "sales" column.
You can format the values in a column using the format option in the define statement. In the code below, dollar format is being applied.
proc report data=mydata;
column product country sales;
define sales / display "Revenue" format=dollar8.;
run;
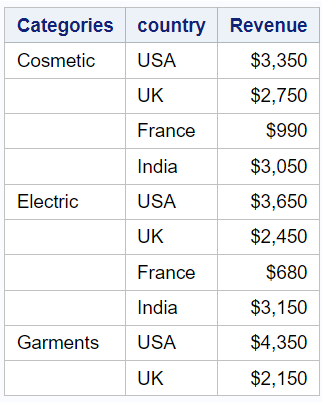
group: This option specifies that the "product" variable should be used for grouping the data in the report. "Categories" is the new header label assigned to the "product" column.
proc report data=mydata;
column product country sales;
define sales / display "Revenue" format=dollar8.;
define product / group "Categories";
run;
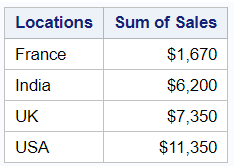
By using PROC REPORT, you can produce descriptive statistics such as sum, mean, min, max etc. In this example, we are calculating sum of sales by countries.
proc report data=mydata;
column country sales;
define country / group "Locations";
define sales / analysis sum "Sum of Sales" format=dollar8.;
run;
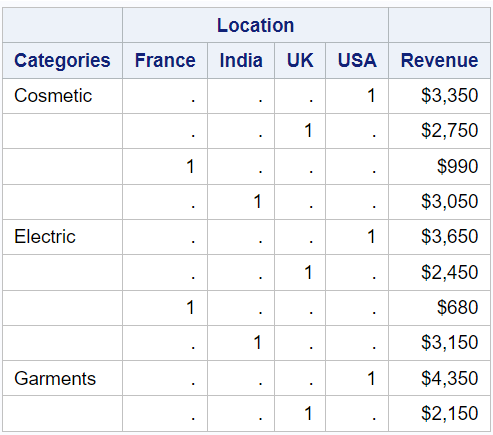
across: This option specifies that the "country" variable should be used for creating a separate header above the data. "Location" is the new header label assigned to the "country" column.
proc report data=mydata;
column product country sales;
define sales / display "Revenue" format=dollar8.;
define product / group "Categories";
define country / across "Location";
run;
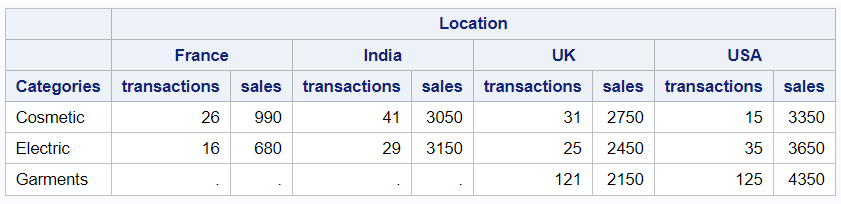
(transactions sales): The "transactions" and "sales" variables will be nested under the "country" column.
proc report data=mydata;
column product country, (transactions sales);
define product / group "Categories";
define country / across "Location";
run;
proc report data=mydata;
column product country, (transactions sales);
define product / group "Categories";
define country / across "Location";
compute after;
product = 'Total';
endcomp;
rbreak after /summarize;
run;
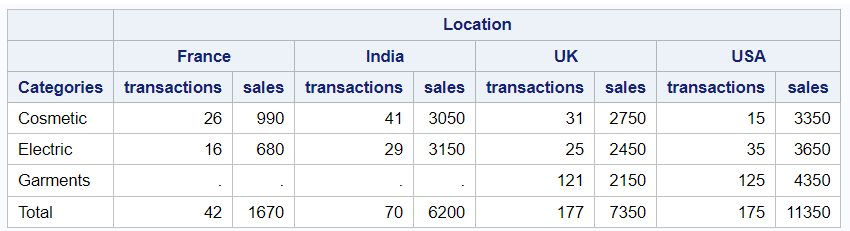
compute after: The COMPUTE AFTER block is used to insert a custom computation after each group of data.product = 'Total';: This line assigns the value "Total" to the "product" variable. It will display "Total" as a row label after each group of data.rbreak after: The RBREAK statement is used to create a row break after each group of data./summarize: The SUMMARIZE option in the RBREAK statement indicates that summary statistics, such as sums, will be displayed for the numeric variables in the report.
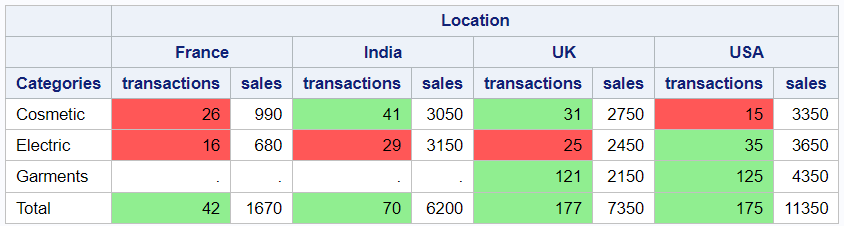
The following code defines a custom format named "mycolor" using PROC FORMAT and then uses it to format the background color of the "transactions" column in the PROC REPORT. If number of transactions are below 30, they will be formatted with a "lightred" background color, else with a "lightgreen" background color.
proc format;
value mycolor
Low-30 = 'lightred'
30-High = 'lightgreen';
run;

proc report data=mydata;
column product country, (transactions sales);
define product / group "Categories";
define country / across "Location";
compute after;
product = 'Total';
endcomp;
rbreak after /summarize;
compute transactions;
call define
(_col_,'style',"STYLE=[BACKGROUND=mycolor.]");
endcomp;
run;
proc report data=mydata
style(column)=[background=lightgrey]
style(header)=[background=grey color=white];
column product country, (transactions sales);
define product / group "Categories";
define country / across "Location";
compute after;
product = 'Total';
endcomp;
rbreak after /summarize;
compute transactions;
call define
(_col_,'style',"STYLE=[BACKGROUND=mycolor.]");
endcomp;
run;
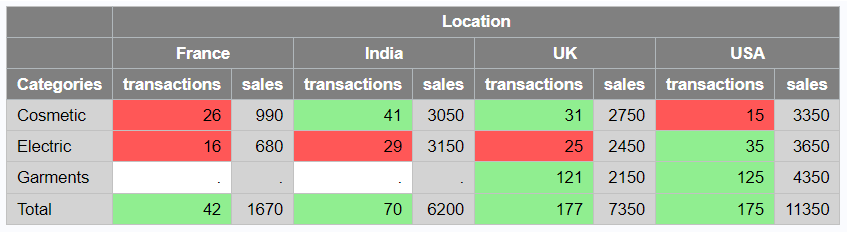
- style(column): This style option applies to all data cells in the columns of the report.
- [background=lightgrey]: This specifies the background color for the data cells in all columns. In this case, the background color will be "lightgrey."
- style(header): This style option applies to all header cells in the report.
- [background=grey color=white]: This specifies the background color for the header cells and also changes the font color to "white." In this case, the background color of the headers will be "grey," and the text color will be "white."

Deepanshu founded ListenData with a simple objective - Make analytics easy to understand and follow. He has over 10 years of experience in data science. During his tenure, he worked with global clients in various domains like Banking, Insurance, Private Equity, Telecom and HR.
Awesome
ReplyDelete