This tutorial explains various ways to create a ROC or AUC Curve in SAS.
ROC curve measures how well a model can differentiate between events and non-events across different classification thresholds. It plots true positive rate (Sensitivity) against false positive rate (1-Specificity) for a binary predictive model.
Let's create a sample SAS dataset for demonstration purpose. In this dataset, dependent variable is "attrition" and independent variables are years of experience and annual salary in dollars.
data mydata;
    input attrition 1-2 yoe 3-4 salary;
    label attrition='Employee Attrition';
    datalines;
0	9	98217
1	5	53477
1	2	22447
1	2	21458
0	2	25990
0	10	106338
1	6	67279
0	4	46575
1	8	83782
0	7	76975
0	4	48110
1	7	74134
1	8	87071
1	9	94795
0	1	16762
0	7	74261
0	8	88497
1	9	92901
0	7	76878
0	9	94273
1	8	87021
;
run;
Method 1 : Creating ROC Curve using PLOTS option
The following code uses the PROC LOGISTIC procedure with the "descending" option to tell SAS that 1 is event (attritors). The plots(only)=roc option is used to create the ROC curve for the model.
proc logistic data=mydata descending plots(only)=roc;
  model attrition = yoe salary;
run;
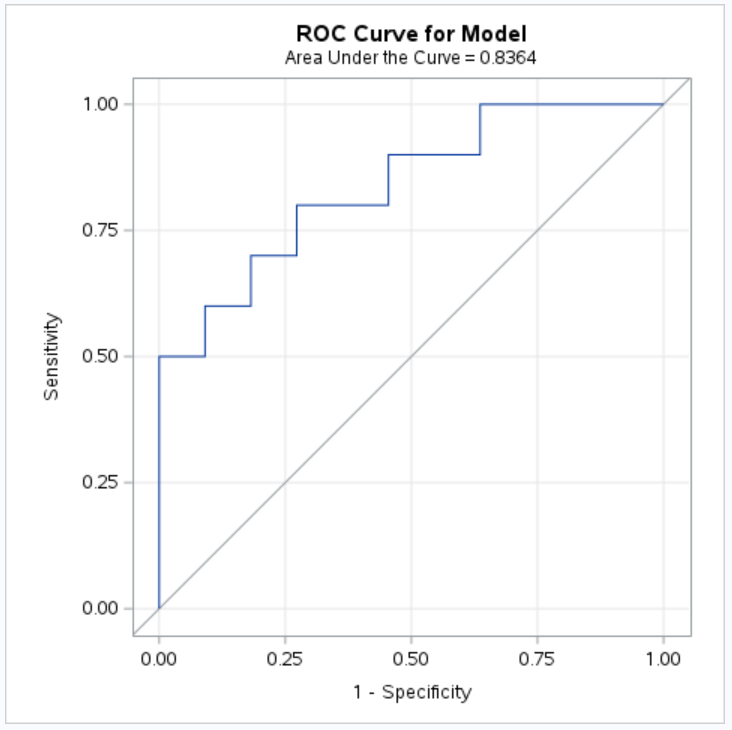
If AUC is closer to 1, it means it's a good model. If AUC is equal to 0.5, it means random guessing and model is of no use. Please make sure to validate model on a dataset other than training to conclude about the performance of the model.
Method 2 : Creating ROC Curve using PROC GPLOT
In this method, we are storing Sensitivity and (1-Specificity) scores in a new dataset using the OUTROC option in PROC LOGISTIC. Then we are plotting them using PROC GPLOT procedure.
proc logistic data=mydata desc;
model attrition = yoe salary /outroc = rocdata ;
run;

proc gplot data=rocdata;
symbol1 i=join v = none c=red line=1;
plot _sensit_ * _1mspec_;
run;
quit;
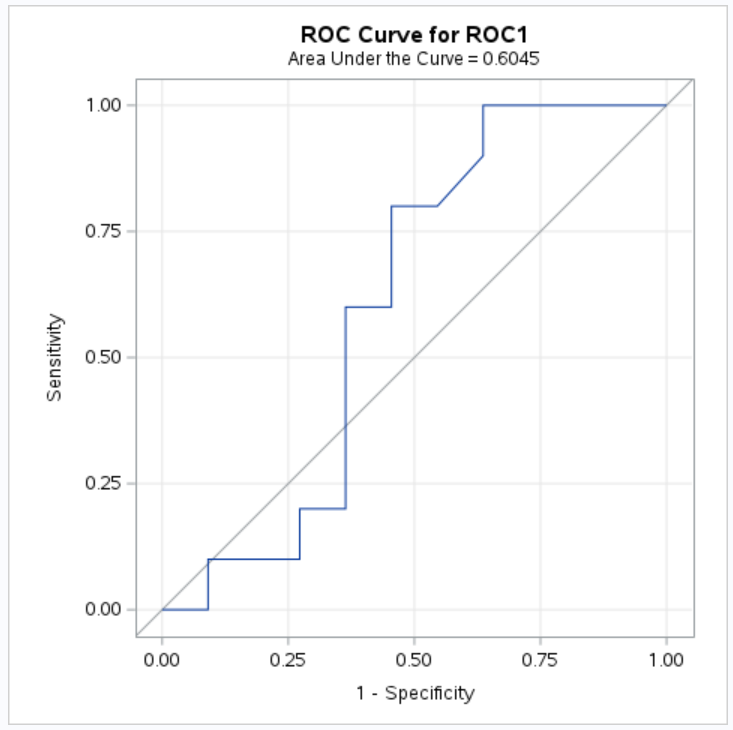
Method 3 : Creating ROC Curve for Any Model
Suppose you have predictive probabilities of a decision tree or random forest model in SAS. You want to create a ROC Curve in SAS. It's a universal approach, not just limited to Logistic Regression model.
data pred;
input prob;
datalines;
0.73
0.68
0.67
0.31
0.1
0
0.28
0.78
0.45
0.95
0.03
0.75
0.66
0.69
0.31
0.91
0.35
0.93
0.56
0.02
0.55
;
run;
First step is to create a dataset which contains both dependent variable and predicted probabilities using MERGE statement. Next step is to use the "nofit" option in the PROC LOGISTIC procedure. It tells SAS that we don't want to build a logistic regression model. Instead we want to create a ROC Curve using the predicted probabilities in the dataset.
data finalData;
   merge mydata pred;
run;

proc logistic data=finalData;
   model attrition(event='1') = prob / nofit;
   roc pred=prob;
   ods select ROCcurve;
run;

Deepanshu founded ListenData with a simple objective - Make analytics easy to understand and follow. He has over 10 years of experience in data science. During his tenure, he worked with global clients in various domains like Banking, Insurance, Private Equity, Telecom and HR.
Share Share Tweet