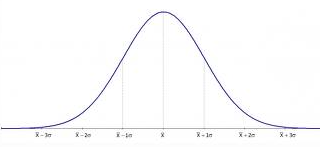
This tutorial explains how to calculate Normal Distribution with MS Excel.
"I'm not an outlier; I just haven't found my distribution yet!"The normal distribution is symmetrical i.e. the left side is a mirror image of the right side. In other words, it has 50% of the scores below mean and 50 % above mean (Mean = Median)

Problem 1: Suppose you are asked to calculate the chances that income of a randomly selected person will be less than 3000 dollars. It is known that the income levels are normally distributed with a mean of 3500 and standard deviation of 500.
Steps to calculate Normal Distribution in MS Excel
- Go to the Formulas tab and click on the "Insert Function" button. Then, choose "Statistical" from the function categories and select "NORMDIST" from the function list. Click "OK" to proceed.
- The NORMDIST function is used to calculate the normal distribution for a given mean and standard deviation.
The syntax of NORMDIST( ) function is as follows -
Syntax:
NORMDIST(x, mean, standard_dev, cumulative)
- x: Represents the value for which you want to calculate the normal distribution.
- mean: Denotes the mean or average value of the distribution.
- standard_dev: Indicates the standard deviation of the distribution.
- cumulative: A logical value that determines the type of distribution. If set to TRUE (or omitted), it returns the cumulative distribution function. If set to FALSE, it returns the probability density function.
=NORMDIST (3000, 3250, 500, TRUE) In this case, it returns 0.3085.
0.3085 is the probability that a randomly selected person’s income is less than 3000 dollars.
Problem 2: Suppose you are asked to calculate the income level which could be exceeded by only top earning 25 percent of people. This means to calculate the income of an individual whose percentile is 75.
How to calculate inverse of Normal Distribution in MS Excel
- Go to the Formulas tab and click on the "Insert Function" button. Then, choose "Statistical" from the function categories and select "NORMINV" from the function list. Click "OK" to proceed.
- The NORMINV function is used to calculate the inverse of the normal distribution for a given mean and standard deviation.
The syntax of NORMINV( ) function is as follows :
= NORMINV (probability, mean, standard deviation)
=NORMINV (0.75, 3250, 500). In this case, it returns 3587 dollars.
Interpretation: This means that the top earning 25 percent of people earn more than 3587 dollars.
Download the example file

Share Share Tweet