This tutorial explains how to perform descriptive statistics using MS Excel. It also helps you to understand descriptive statistics in detail along with examples.
Descriptive Statistics answers the following questions:
- What is the value that best describes the data set?
- How much a data set speads from its average value?
- What is the smallest and largest number in a data set?
It provides information on summary statistics that includes Mean, Standard Error, Median, Mode, Standard Deviation, Variance, Kurtosis, Skewness, Range, Minimum, Maximum, Sum, and Count.
In other words, it consists of measures of central tendency, variability, skewness and kurtosis.
Measures of central tendency are used to find the single value that best describes about the entire distribution. There are three main measures of central tendency: Mean, Median and Mode.
| Statistic | Description | Excel Function |
|---|---|---|
| Mean | Average value | AVERAGE |
| Median | Middle value | MEDIAN |
| Mode | Most frequent value | MODE |
Measures of Variability refers to the spread or dispersion of scores. There are four main measures of variability: Range, Inter quartile range, Standard deviation and Variance.
| Statistic | Description | Excel Function |
|---|---|---|
| Range | Difference between max and min in a distribution | =MAX(A1:A9)-MIN(A1:A9) |
| Standard Deviation | Average distance of scores in a distribution from their mean | STDEV |
| Variance | Square of the standard deviation | VAR |
| Skewness | Degree to which scores in a distribution are spread out. | SKEW |
| Kurtosis | How tails of a distribution differ from normal distribution. | KURT |
Example 1 : Suppose you are asked to calculate the average asset value of top stock funds and check whether there is any variability in the assets of these stock funds. You would answer this question with a measure of central tendency and variability.
Example 2 : Suppose you are asked to provide a figure that best describes the annual salary offered to students in ABC College you would answer this question with a measure of central tendency and variability.
Steps to Calculate Descriptive Statistics using MS Excel
1. If you haven't already installed the Analysis ToolPak, Open Microsoft Excel. Go to the "File" menu and select "Options". In the Excel Options dialog box, click on "Add-Ins" on the left sidebar. In the "Manage" drop-down menu at the bottom, select "Excel Add-ins" and click "Go." In the Add-Ins dialog box, check the box for "Analysis ToolPak" and click "OK". How to Install Analysis ToolPak
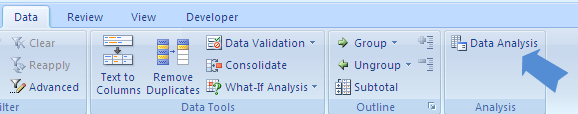
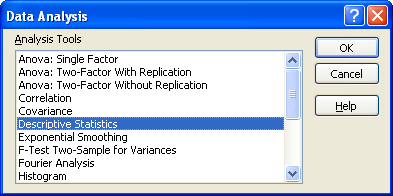
2. Select Data tab, then click on the Data Analysis option, then selects Descriptive Statistics from the list and Click Ok. [Data tab >> Data Analysis >> Descriptive Statistics]
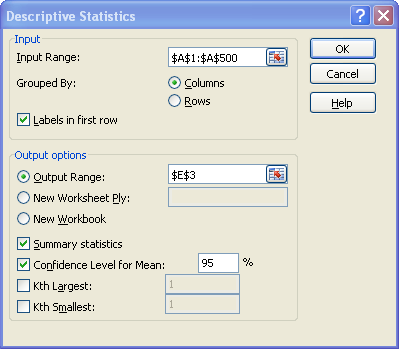
3. In the Input Range we select the data, and then select Output Range where you want the output to be stored. If you don’t specify the output range it will throw output in the new worksheet.
4. Check Summary Statistics and Confidence Level for Mean options. By default the confidence level is 95%. You can change the level as per the hypothesis standard of study.
5. When you click Ok, you will see the result in the selected output range.
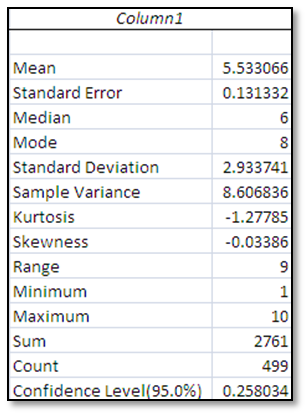
The average value is 5.533. The middle value is 6 and the most frequent value is 8. Negative skewness indicates a left skewed data. Negative kurtosis indicates that the distribution has lighter tails than the normal distribution. The 95% confidence level indicates you can be 95% sure that the true percentage of the population lies between 5.275 (5.533 – 0.258) and 5.791 (5.533 + 0.258).
Using Excel Functions:You can accomplish the same task using excel functions such as AVERAGE, MEDIAN, MODE, SUM, STDEV, KURT, MAX, MIN, CONFIDENCE.
- Mean - Use the mean when your data is not skewed, meaning it is normally distributed and does not contain extreme values or outliers.
- Median - Use the median when your data is skewed or when you are dealing with ordinal data, such as a Likert scale (e.g., 1. Strongly dislike, 2. Dislike, 3. Neutral, 4. Like, 5. Strongly like).
- Mode - Use the mode when dealing with nominal data, which consists of unordered categories.
In real life, consider a scenario where a company is considering expansion into a new area and is studying the sizes of containers offered by competitors. In this case, they would be more interested in the mode because they want to know the container size that sells most frequently.

Deepanshu founded ListenData with a simple objective - Make analytics easy to understand and follow. He has over 10 years of experience in data science. During his tenure, he worked with global clients in various domains like Banking, Insurance, Private Equity, Telecom and HR.
why count is changing on changing confidence level
ReplyDeleteCorrections:
ReplyDeleteKurtosis
Flatness or peakness of the curve
should be
Kurtosis
Measures of rare, extreme values the curve
And
Negative kurtosis indicates a flat distribution.
should be
Negative kurtosis indicates a distribution with less rare, extreme values than a normal distribution.
(Explanation: Kurtosis does not measure "peakedness" or "flatness." Those are historically incorrect descriptions.)