A Frequency Distribution is a summary of how often each value occurs by grouping values together.
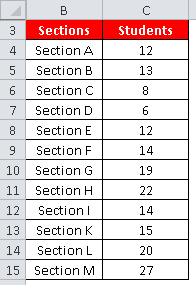
For example, you have data for class sections with the number of students in each section.
 |
| Excel : Frequency Distribution |
There are multiple ways to calculate frequency distribution (table) with Excel.
- With COUNTIFS Function
- With FREQUENCY Function
Step 1 : Enter the above data in cells B3:C15. The first row of table has headers.
The same data entered into a sheet in excel appears as follows :

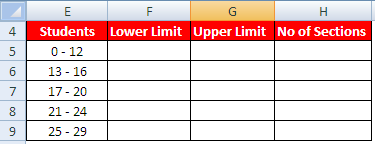
Step 2 : Select the desired class intervals
Step 3 : Create a table with the columns - Class intervals, Lower limit, Upper limit and Frequency.

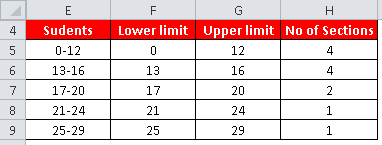
Step 4 : Calculate lower and upper limits
Suppose class interval column starts from cell E5 (excluding header).
Lower limit -Enter the following formula in cell F5 and paste it down till the last row of the table.
=MID(E5,1,FIND("-",E5,1)-1)Upper limit -
Enter the following formula in cell G5 and paste it down till the last row of the table.
=MID(E5,FIND("-",E5,1)+1,2)
Step 5 : Calculate the count in each class intervals.
To calculate the last column of the above table, enter the following formula in cell H5 and paste it down till the last row of the table.
=COUNTIFS($C$4:$C$15,">="&F5,$C$4:$C$15,"<="&G5)

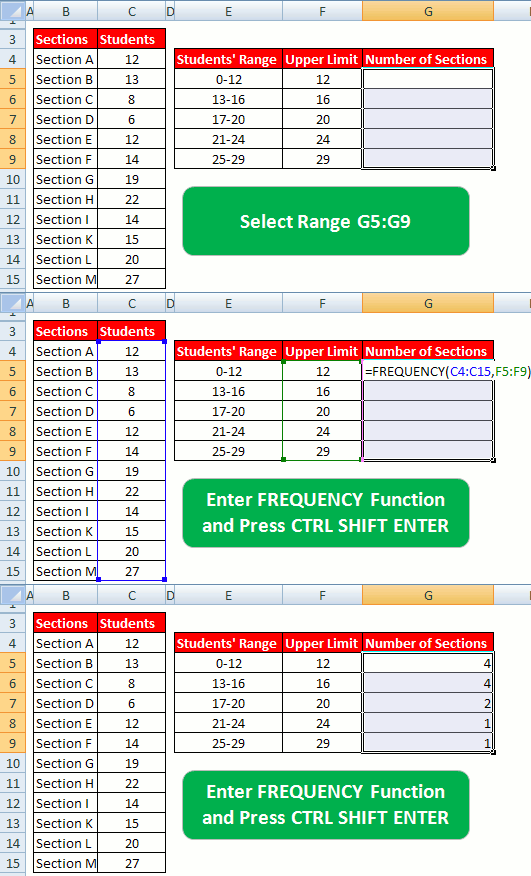
Create a table with the columns - Class Intervals, Upper Limit and Number of Sections

Upper Limit can be calculated with the formula below in cell F5 -
=MID(E5,FIND("-",E5,1)+1,2)
Paste the formula down till cell F9. Make sure you enter double minus (--) before MID function.
In the next step, select range G5:G9 and then enter FREQUENCY Function
=FREQUENCY(C4:C15, F5:F9)
F5:F9 refers to bins of Upper Limit.
Press CTRL SHIFT ENTER to submit the above FREQUENCY formula as it's an array formula. If it is entered correctly, you would see formula wrapped in curly braces { }
We can prepare histogram using frequency table.

- Highlight the values in the class intervals column (Column E) and Frequency column (Column H) of the frequency distribution table. (Hold down Ctrl key while highlighting two ranges)
- Click on the Insert tab and select Clustered Column from the Column or Bar Chart dropdown menu.
- Remove Series1: Click on the chart to select it, then right-click on Series1 in the chart legend and select Delete.
- Click on the chart.
- Click the Chart Design tab under Chart Tools.
- Click Add Chart Element in the Chart Layouts group.
- Hover over Axis Titles.
- Select Primary Horizontal.
- Select Primary Vertical.
- Select the chart.
- Right-click on the vertical axis (y-axis) of your chart.
- Select Format Axis from the menu.
- In the Format Axis pane, expand the Axis Options section if it's not already expanded.
- Under Bounds, for Minimum, select Fixed and enter the lowest number you want on your Y-axis. For example, enter 0.
- For Maximum, select Fixed and enter the number where you want the Y-axis to end. For example, enter 5.
- Close the Format Axis pane.


...or you can just use the array formula frequency
ReplyDeletenicely DONE !!!
ReplyDeleteAny suggestions on how to arrange in inclusive method?
ReplyDeleteTq so much it was much of help
ReplyDelete