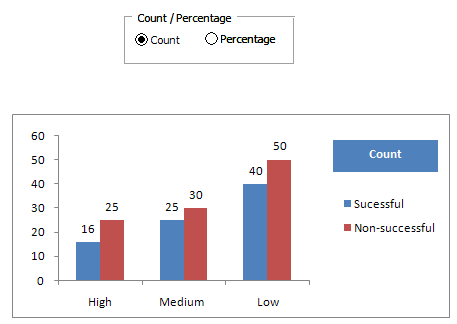
This tutorial explains how to change chart from count to percent using Options Button.
Options Button
Like drop down, the Option Button form Control allows the
selection of a single item from a list of items. When one item is selected, the other remaining options would be unchecked.
 |
| Change Chart from Count to Percent |
Steps
1. Prepare Data for Count and Percent
 |
| Count and Percent Data |
2. Create two
Options Button
 |
| Create Options Button |
3. Right click on Options Button and go to
Control tab and give cell reference (say, $I$6) to
Cell link.
 |
| Options Button : Reference to Cell Link |
4. Add Group Box
 |
| Add Group Box |
It is used for grouping similar controls so that functional groups of controls can be maintained and the users flow is directed around a form.
Group Options Buttons and Group Box
Select Options Buttons and Group Box by using
CTRL SHIFT shortcut keys and then right click and click on Group.
 |
| Put Options Button Inside Group Box |
5. Create Chart Range
=IF($I$6=1,M6,ROUND(M10,2))
 |
| Create Chart Range |
6. Add Custom Format to Chart Range
[>=1] #,##0;[>0] 0%;0
If a cell value is whole number, then add number format. Otherwise, use % format.
7. Create Chart
Select chart range and then press ALT N C and select column chart.
Download Excel Chart
About Author:
Deepanshu founded ListenData with a simple objective - Make analytics easy to understand and follow. He has over 10 years of experience in data science. During his tenure, he worked with global clients in various domains like Banking, Insurance, Private Equity, Telecom and HR.


Share Share Tweet