Table of Contents
What is Shiny in R?
Shiny is a R package developed by RStudio that can be used to create interactive web pages with R. In simple words, you can build web page (online reporting tool) without knowing any web programming languages such as Javascript / PHP / CSS.The best part about shiny package is that you can easily integrate R with webpage. Suppose you want your web page run machine learning algorithms like random forest, SVM etc and display summary of the model with the flexibility of selecting inputs from user. Shiny can do it very easily.
 |
| R : Shiny Tutorial |
Features of Shiny Package
- Customizable widgets like sliders, drop down lists, numeric inputs and many more.
- Downloading datasets, graphs and tables in various formats.
- Uploading files.
- Provides utility to create brilliant plots.
- In-built functions for viewing data or printing the text or summaries.
- Reactive programs which makes data handling easier.
- Conditional Panels for only when a particular condition is present.
- Works in any R environment (Console R, RGUI for Windows or Mac, RStudio, etc)
- No need to learn another software for online dashboarding
- Can style your app with CSS / HTML (Optional)
Must things in shiny app code
User Interface (UI) :It controls the layout and appearance of various widgets on the web page. Every shiny app requires a user interfacewhich is controlled by ui script.Server :It contains the instructions that your computer needs when the user interacts with the app.
The UI is responsible for creating these drop downs, list boxes and telling Shiny where to place these user controls and where to place the charts, while the server is responsible for creating the chart and the data in the table
Basic layout of UI
User Interface:A simple shiny UI consists of a fluidpage which contains various panels. We can divide the display in two parts named sidebdarPanel( )and mainPanel( ).Both of the panels can be accessed using sidebarLayout( ).In the following image you can get an idea what is a title panel, sidebar panel and main panel in a shiny app.
- Title panel is a place where the title of the app is displayed.
- Sidebar panel is where special instructions or widgets (drop down / slider/ checkbox) are displayed to the app user.The sidebar panel appears on the left side of your app by default. You can move it to the right side by changing the position argument in the sidebar layout.
- Main panel is the area where all the outputs are generally placed.
 |
| Shiny Elements |
Installing and Loading Shiny
First we need to install shiny package by using command install.packages( )
install.packages("shiny")
Shiny package can be loaded by using library( ).
library(shiny)
First simple shiny app with basic layout
ui = fluidPage(sidebarLayout(sidebarPanel("Welcome to Shiny App"),
mainPanel("This is main Panel")))
server = function(input, output) { }
shinyApp(ui, server)
 |
| Sidebar Panel and Main Panel |
Guidelines for beginners to run a shiny app
Step 1 : shinyApp(ui,server):It is an in-built function in shiny package to run the app with ui and server as the arguments. Select the code and run it. Once you do it successfully, you would find the text Listening on http://127.0.0.1:4692on console.Step 2 :To create your app you need to save the code as an app.R file and aRunApp icon will get displayed on your screen. Click on it and a new prompt window as your app will appear.
 |
| Shiny App |
Some more panels...
There are some additional panels which can be added to sidebarPanel and mainPanel depending upon the layout and requirements of the app. Some of them which shall be explained later in this tutorial are:
 |
| Shiny : Panels |
Adding a title to your App
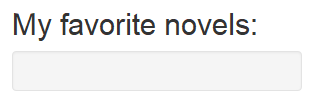
Using titlePanel( )once can provide an appropriate title for the app. Note that after titlePanel a comma(,) is placed.
ui = fluidPage(titlePanel("My favorite novels:"),
sidebarLayout(sidebarPanel(),
mainPanel()))
server = function(input, output) {
}
shinyApp(ui, server)
 |
| Title : Shiny App |
Using HTML tags in Shiny
Content can be added in various panels. To change the appearance of the text by bolds, italics, images, changing the fonts and colors, adding heading etc. we can use various HTML functions in shiny. Some of them being the same in both of them are: |
| HTML Tags |
Creating a hyperlink
A hyperlink can be created using a( ) where the first argument is the text with which the link is attached. href contains the link for our website which we want to attach.
ui = fluidPage(sidebarLayout(sidebarPanel(
a("Click here!", href = "http://www.listendata.com/")),
mainPanel()))
server = function(input, output) {}
shinyApp(ui, server)
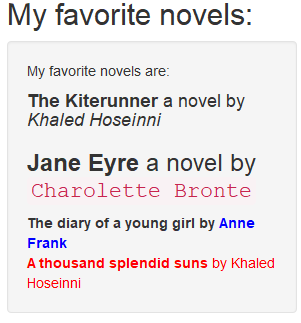
Modifying the text presentation using HTML tags.
We create an app containing the list of the favorite novels . You can refer to the above mentioned table of HTML and shiny functions.
ui = fluidPage(titlePanel("My favorite novels:"),
sidebarLayout(sidebarPanel(
("My favorite novels are:"),
br(),
h4(strong("The Kiterunner"), "a novel by", em("Khaled Hoseinni")),
h2(strong("Jane Eyre"), "a novel by", code("Charolette Bronte")),
strong(
"The diary of a young girl",
"by",
span("Anne Frank", style = "color:blue")
),
div(strong("A thousand splendid suns"), "by Khaled Hoseinni", style = "color: red")
),
mainPanel()))
server = function(input, output) { }
shinyApp(ui, server)
Note that "Charolette Bronte" in the app would be written in a coded style;Difference between span( ) and div( )span( ) wrote "Anne Frank" on the same line with "blue" color. div( ) is similar to span( ), it is just that it creates the text in a different line.
 |
| Shiny : HTML Formating |
Introducing widgets
Various widgets are used in shiny to select various outputs. These widgets can be inserted in the ui function (anywhere in the main panel and sidebar panel).The most commonly used widgets are:
 |
| Shiny Widgets |
The following image tells how various widgets appear on running an app.
 |
| Shiny Widgets |
- 'Buttons' can be created using an actionButton and submitButton widgets
- Single check box, multiple check box and date inputs are created using checkboxInput, checkboxGroupInput and dateInput respectively.
- Date range is created using dateRangeInput.
Most commonly used widgets
All the widgets demand an input ID which we will use to retrieve the values. This input ID is not accessible by the app user. labels is the heading for our widget which be visible on when the app is being run. In order to understand more we create an app to get the details of the user by the widgets provided by shiny.HelpText and TextInput
ui = fluidPage(sidebarLayout(
sidebarPanel(helpText("This questionnaire is subject to privacy."),
textInput(inputId = "name", label = "Enter your name.")
),
mainPanel()
))
server = function(input, output) { }
shinyApp(ui, server)
 |
| helptext() and Text Input |
helpText( ) creates a disclaimer which will be displayed on the sidebarPanel.
Adding SliderInput
ui = fluidPage(sidebarLayout(
sidebarPanel(
helpText("This questionnaire is subject to privacy."),
textInput(inputId = "name", label = "Enter your name."),
sliderInput(
inputId = "age",
label = "What is your age?",
min = 1,
max = 100,
value = 25
)
),
mainPanel()
))
server = function(input, output) { }
shinyApp(ui, server)
In sliderInput we use the ID as "age" and the label which will be displayed in our app is "What is your age?" min = 1 and max = 100 depict the minimum and maximum values for our sliders and value = 25 denotes the default selected value.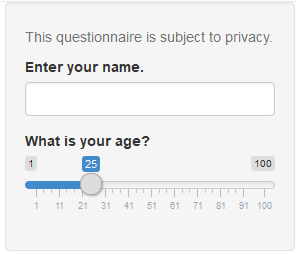 |
| SliderInput |
RadioButtons, NumericInput and CheckBoxInput
ui =  fluidPage(sidebarLayout(
  sidebarPanel(
    radioButtons(
      inputId = "month",
      label = "In which month are you born?",
      choices = list(
        "Jan - March" = 1,
        "April - June" = 2,
        "July - September" = 3,
        "October - November" = 4
      ),
      selected = 1
    ),

    numericInput(
      inputId = "children_count",
      label = "How many children do you have?",
      value = 2,
      min = 0,
      max = 15
    ),

    selectInput(
      inputId  = "smoker",
      label = "Are you a smoker?",
      choices = c("Yes", "No", "I smoke rarely"),
      selected = "Yes"
    ),

    checkboxInput(
      inputId = "checkbox",
      label = "Are you a human?",
      value = FALSE
    ),

    checkboxGroupInput(
      inputId = "checkbox2",
      label = "2 + 2 = ?",
      choices = list(4, "Four", "IV", "None of the above")
    )

  ),
  mainPanel()
))
server = function(input, output) { }
shinyApp(ui, server)
 |
| Other common Widgets |
In radioButtons or selectInput widgets we define the list of options in choices parameter. The parameterselected implies the default selected option.
Using fluidRow
The output of our above app is a bit weird. Right? Everything comes in the sidepanel and nothing on the mainPanel. We can make it a bit more sophisticated by removing the mainPanel and creating the widgets in a row.We use fluidRow for such things. It is to be kept in mind that the width of the row is 12thus if a row contains the widgets which require in more than 12 units of width then the last widget will be displayed on the other row.
Let us create the above same app using fluidRow.
Our app creates textInput, sliderInput and radioButtons in one row.
ui =  fluidPage(
  helpText(
    "This questionnaire is subject to privacy. All the information obtained will be confidential."
  ),


  fluidRow(
    column(4,textInput(inputId = "name", label = "Enter your name.")),


    column(
      4, sliderInput(
        inputId = "age",
        label = "What is your age?",
        min = 1,
        max = 100,
        value = 25
      )
    ),

    column(
      4, radioButtons(
        inputId = "month",
        label = "In which month are you born?",
        choices = list(
          "Jan - March" = 1,
          "April - June" = 2,
          "July - September" = 3,
          "October - November" = 4
        ),

        selected = 1
      )
    )
  ),


  fluidRow(column(
    6, numericInput(
      inputId = "children_count",
      label = "How many children do you have?",
      value = 2,
      min = 0,
      max = 15
    )
  ) )
  )
server = function(input, output) { }
shinyApp(ui, server)
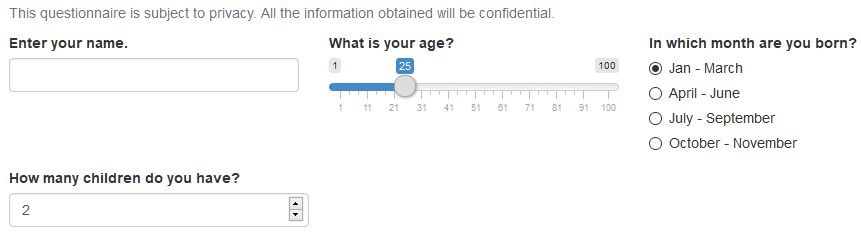 |
| fluidrow |
In column(6,...) 6 denotes the width required by one widget.To move to the next row another fluidRow command is used.
Time to get some output
So far we have been providing the input to our server function but note that server function also has an output as an argument. Thus we can have various outputs like:
The above functions are defined in ui and are given a key and using that key we denote them in the server function.
Dealing with dates
Using dateInput( ) we can select the dates from our calendar.The inputID is "bday", and the label which will be displayed in our app is "Enter your Date of Birth" and by default value is 1st January, 1985.
The verbatimTextOutput is used in the ui and it will be referred in the server as "text".
In the server function we use output$text to tell shiny that the following output will be displayed in verbatimTextOutput("text").
The renderPrint( ) denotes our output to be printed and we get the date of birth printed using input$bday (Recall bday was the inputID in our dateInput).
ui = fluidPage(dateInput(
"bday",
label = h2("Enter your Date of Birth"),
value = "1985-01-01"
),
verbatimTextOutput("text"))
server = function(input, output) {
output$text <- renderPrint({
paste(input$bday, "was a blessed day!")
})
}
shinyApp(ui, server)
Viewing Data
Here we are using the iris dataset and we want to display only the data for the particular specie selected by the user.Using selectInput( ) we choose the specie with inpuID as "specie". In the main panel we want out output as a table thus we use tableOutput( ). In the server( ) output$data matches tableOutput("data") and renders a table using renderTable.
ui = fluidPage(titlePanel("Viewing data"),
sidebarLayout(sidebarPanel(
selectInput(
inputId = "specie",
label = "Select the flower specie",
choices = c("setosa", "versicolor", "virginica"),
selected = "setosa"
)
),
mainPanel(tableOutput("data"))))
server = function(input, output) {
output$data = renderTable({
iris[iris$Species == input$specie, ]
})
}
shinyApp(ui, server)
Reactivity in Shiny
Shiny apps use a functionality called reactivity that means that shiny app will be responsive to changes to inputs. It's similar to MS Excel where changing one cell has effect on the dependent cell or formula.The above definition is not correct technically. Technically, reactive expressions don't re-execute right away when their dependencies change but rather wait until they are called by someone else. Indeed, if they are not called then they will never re-execute.
In the example below, we are creating a reactive function which can be used anywhere within the session to avoid defining it multiple times and it will also avoid recalculation.
library(shiny)
ui <- fluidPage(
mainPanel(
numericInput("num_a", "Observations:", 10, 1, 500),
numericInput("num_b", "Observations:", 10, 1, 500),
textOutput("text_calc"))
)
server <- function(input, output){
formula <- reactive({
A <- input$num_a
B <- input$num_b
A*B
})
output$text_calc <- renderText({
paste("The result is =", formula())
})
}
shinyApp(ui = ui, server = server)
Observe( )
Unlike reactive( ), observers re-execute right away as soon as their dependencies change. Another difference between reactive( ) and observe( ) -observe( ) doesn't return a result and can't be used as an input to other reactive expressions.
Similarity between reactive( ) and observe( ) -It can read reactive values and call reactive expressions.
In the code below, numeric input automatically changes when user changes values from slider input.
ui <- fluidPage(
sliderInput("slider", "Move to right or left", value = 3, 1, 5),
numericInput("number", "Number", value = 3, 1, 5)
)
server <- function(input, output, session) {
observe({
updateNumericInput(session, "number", value = input$slider)
})
}
shinyApp(ui = ui, server = server)
observeEvent( )It comes into action based on event-like reactive inputs, values, and expressions. Suppose user clicks on action button, only then some calculations will come into effect.
library(shiny)
ui = fluidPage(
  actionButton("unif", "Uniform"),
  textOutput("txt")
)
server = function(input, output){
  d = reactiveValues(data=NULL)

  observeEvent(input$unif,
    {d$data = runif(100)}
  )

  output$txt = renderText(
    {
      if (is.null(d$data)) return()
      summary(d$data)
    }
  )
}
shinyApp(ui, server)
reactiveValues( )It is used to store reactive values. Values taken from the reactiveValues object are reactive, but the reactiveValues object itself is not. See the usage of it in the previous example.
Creating Plots
Here we want to display the histogram by selecting any one variable in the iris dataset available in R.
Using plotOutput in main panel we refer to the server function.
In the server function we are using reactive. It means that it will change the value only when the value input$characterstic is changed.
The output$myplot matches to plotOutput("myplot") and hence draws the histogram using renderPlot( )
ui =  fluidPage(titlePanel("Creating the plots!"),
                sidebarLayout(sidebarPanel(
                  selectInput(
                    inputId  = "characterstic",
                    label = "Select the characterstic for which you want the histogram",
                    choices = c("Sepal Length", "Sepal Width" ,
                                "Petal Length", "Petal Width"),
                    selected = "Sepal Length"
                  )
                ),

                mainPanel(plotOutput("myplot"))))
server = function(input, output) {
  char = reactive({
    switch(
      input$characterstic,
      "Sepal Length" = "Sepal.Length",
      "Sepal Width" = "Sepal.Width",
      "Petal Length" = "Petal.Length",
      "Petal Width" = "Petal.Width"
    )
  })
  output$myplot  = renderPlot({
    hist(
      iris[, char()],
      xlab = input$characterstic,
      main = paste("Histogram of", input$characterstic)
    )
  })
}
shinyApp(ui, server)
Well Panel and Vertical Layout
- Vertical Layout creates a layout in which each element passed in the UI will appear in its own line.
- Well Panel creates a panel with a border and a grey background.
Using the sliders we define the size of the sample. By default it is 500.
ui = fluidPage(titlePanel("Vertical layout"),
               verticalLayout(wellPanel(
                 sliderInput("n", "QQ Plot of normal distribution", 100, 1000,
                             value = 500)
               ),
               plotOutput("plot1")))
server = function(input, output) {
  output$plot1 = renderPlot({
    qqnorm(rnorm(input$n))
  })
}
shinyApp(ui, server)
Creating tabs
We can create various tabs in shiny where some particular output is displayed in a particular tab. This can be done using tabsetPanel.We are creating an app in which the user selects the columns for which he wants the summary and the boxplot.
In the main panel we are creating the tabs. each tab has a label and the output to be shown.
For instance the first tab label is 'Summary' and it will show the verbatimTextOutput and the other tab will have label displayed as 'Boxplot' with output being plotted using plotOutput.
ui =  fluidPage(titlePanel("Creating the tabs!"),
                sidebarLayout(sidebarPanel(
                  radioButtons(
                    inputId  = "characterstic",
                    label = "Select the characterstic for which you want the summary",
                    choices = c(
                      "Mileage" = "mpg",
                      "Displacement" = "disp",
                      "Horsepower" = "hp",
                      "Rear axle ratio" = "drat",
                      "Weight" = "wt"
                    ),
                    selected = "mpg"
                  )
                ),
                mainPanel(tabsetPanel(
                  tabPanel("Summary", verbatimTextOutput("mysummary")),
                  tabPanel("Boxplot", plotOutput("myplot"))
                ))))
server = function(input, output) {
  output$mysummary = renderPrint({
    summary(mtcars[, input$characterstic])
  })

  output$myplot  = renderPlot({
    boxplot(mtcars[, input$characterstic], main = "Boxplot")
  })
}
shinyApp(ui, server)
 |
| Creating tabs in Shiny |
Some more plots...
In this example we are using VADeaths data. We firstly select the area (Rural or Urban) and gender( Male or Female) and hence plot the barplot denoting the death rate for different age groups.ui = fluidPage(
titlePanel("Death rates by Gender and area"),
sidebarLayout(
sidebarPanel(
selectInput("area", "Choose the area",
choices = c("Rural", "Urban")),
br(),
selectInput("gender", "Choose the gender", choices = c("Male", "Female"))
),
mainPanel(plotOutput("deathrate"))
)
)
server = function(input, output) {
output$deathrate <- renderPlot({
a = barplot(VADeaths[, paste(input$area, input$gender)],
main = "Death Rates in Virginia",
xlab = "Age Groups")
text(a,
y = VADeaths[, paste(input$area, input$gender)] - 2,
labels = VADeaths[, paste(input$area, input$gender)],
col = "black")
})
}
shinyApp(ui, server)
Dynamic User Interface
Till now, we were using textOutput( ),tableOutput( ) and plotOutput( ) functions to show our output based on some inputs. Suppose you want to show all the three types of output based on radio-button. If user selects plot, it should show chart. If user wants to see the output in table format, it should return output in tabular format.
This kind of dynamic interface can be created using conditionalPanel and renderUI functions.
- conditionalPanel( ) is used in ui.R and wraps a set of UI elements that need to be dynamically shown/hidden.
- renderUI( ) is used in server.R along with the uiOutput function in ui.R
Conditional Panels
Suppose you wish to create outputs only when a particular option is selected or if a particular condition is satisfied. For such a purpose we can use conditional panels where we define the condition in a JavaScript format and then define the output or the widget to appear if the condition is met. A simple example of a conditional panel is given as follows: Firstly we seek the number of hours one sleeps and then if someone sleeps for less than 7 hours then he needs more sleep and if someone sleeps more than or equal to 9 hours then he sleeps a lot.ui = fluidPage(
titlePanel("Conditional Panels"),
sidebarPanel(
numericInput("num","How many hours do you sleep?",min = 1,max = 24,value = 6)),
mainPanel(
conditionalPanel("input.num < 7","You need more sleep"),
conditionalPanel("input.num >= 9","You sleep a lot")
)
)
server = function(input,output){
}
shinyApp(ui,server)
Note:The first argument in conditional panel is a JavaScript expression thus we write input.num and not input$num to access the input value of sleeping hours.
Conditional Panel : Example 2
In the following example we are using the income.csv file.
Firstly we ask for which variable the user wants to work with and save the data in 'a' using reactive( ) . Then we using uiOutput we insert a widget asking for whether the user wants the summary or to view the data or the histogram. Based on the option selected by the user we create conditional panels for summary, viewing the data and plotting the histogram.
income = read.csv("income.csv", stringsAsFactors = FALSE)
ui = fluidPage(titlePanel(em("Conditional panels")),
                sidebarLayout(
                  sidebarPanel(
                    selectInput(
                      "Choice1",
                      "Select the variable",
                      choices = colnames(income)[3:16],
                      selected = "Y2008"
                    ),
                    uiOutput("Out1")
                  ),
                  mainPanel(
                    conditionalPanel("input.Choice2 === 'Summary'", verbatimTextOutput("Out2")),
                    conditionalPanel("input.Choice2 === 'View data'", tableOutput("Out3")),
                    conditionalPanel("input.Choice2 === 'Histogram'", plotOutput("Out4"))
                  )
                ))
server = function(input, output) {
  a = reactive({
    income[, colnames(income) == input$Choice1]
  })
  output$Out1 = renderUI({
    radioButtons(
      "Choice2",
      "What do you want to do?",
      choices = c("Summary", "View data", "Histogram"),
      selected = "Summary"
    )
  })
  output$Out2 = renderPrint({
    summary(a())
  })
  output$Out3 = renderTable({
    return(a())
  })
  output$Out4 = renderPlot({
    return(hist(a(), main  = "Histogram", xlab = input$Choice1))
  })
}
shinyApp(ui = ui, server = server)
Downloading Data
shiny allows the users to download the datasets. This can be done by using downloadButton in UI and downloadHandler in server. Firstly we select the data using radioButtons and hence save the dataset using reactive( ) in server. Then in the UI we create a downloadButton where the first argument is the inputID and the other one is the label. downloadHandler needs two arguments: filename and content.In 'filename' we specify by which name the file should be saved and using content we write the dataset into a csv file.ui = fluidPage(titlePanel("Downloading the data"),
sidebarLayout(sidebarPanel(
radioButtons(
"data",
"Choose a dataset to be downloaded",
choices = list("airquality", "iris", "sleep"),
selected = "airquality"
),
downloadButton("down", label = "Download the data.")
),
mainPanel()))
server = function(input, output) {
# Reactive value for selected dataset ----
datasetInput = reactive({
switch(input$data,
"airquality" = airquality,
"iris" = iris,
"sleep" = sleep)
})
# Downloadable csv of selected dataset ----
output$down = downloadHandler(
filename = function() {
paste(input$data, ".csv", sep = "")
},
content = function(file) {
write.csv(datasetInput(), file, row.names = FALSE)
}
)
}
shinyApp(ui, server)
Uploading a file
So far we were dealing with inbuilt datasets in R. In order to allow the users to upload their own datasets and do the analysis on them,fileInput function in UI in shiny allows users to upload their own file. Here we are creating an app to upload the files. In fileInput 'multiple = F' denotes that only one file can be uploaded by the user and 'accept = csv' denotes the type of files which can be uploaded. Then we ask the user whether he wants to view the head of the data or the entire dataset which is then viewed by using renderTable.library(shiny)
ui = fluidPage(titlePanel("Uploading file in Shiny"),
sidebarLayout(
sidebarPanel(
fileInput(
"myfile",
"Choose CSV File",
multiple = F,
accept = ".csv"
),
checkboxInput("header", "Header", TRUE),
radioButtons(
"choice",
"Display",
choices = c(Head = "head",
All = "all"),
selected = "head"
)
),
mainPanel(tableOutput("contents"))
))
server = function(input, output) {
output$contents = renderTable({
req(input$myfile)
data = read.csv(input$myfile$datapath,
header = input$header)
if (input$choice == "head") {
return(head(data))
}
else {
return(data)
}
})
}
shinyApp(ui, server)
Sharing the app with others
Method I : Sharing the R code: You can share you app with others by sharing your R code. To make it work, users need to have R installed on their system.Method II : Share your app as a web page:You need to create an account on shinyapps.io and follow the instructions below to share your app.R file.
Deploying shiny app on shinyapps.io
First you need to have an account on shinyapps.io.Import library rsconnect by using
library(rsconnect)Then you need to configure the rsconnect package to your account using the code below -
rsconnect::setAccountInfo(name="<ACCOUNT>", token="<TOKEN>", secret="<SECRET>")To deploy the app you can write:
rsconnect::deployApp(' Folder path in which your app.R file is saved')
As a result a new web page of your app link will be opened.
Shiny App for Normality
In this app the user first selects the variable for which he wants to test the normality. Then he is asked whether he wants to check normality via plots or some statistical tests. If the user selects plots then he will be asked whether he wants a Histogram or a QQ-Plot. The link for the shiny app is: My Shiny Appui = fluidPage(titlePanel("My first App"),
sidebarLayout(
sidebarPanel(
selectInput(
"varchoice",
"Choose the variable for which you want to check the normality",
choices = c("mpg", "disp", "drat", "qsec", "hp", "wt")
),
radioButtons(
"normchoice",
"How do you want to check the normality?",
choices = c("Plots", "Tests"),
selected = "Plots"
),
conditionalPanel(
"input.normchoice == 'Plots'",
selectInput(
"plotchoice",
"Choose which plot you want?",
choices = c("Histogram", "QQ-Plot")
)
)
),
mainPanel(
conditionalPanel("input.normchoice == 'Plots'", plotOutput("myplot")),
conditionalPanel("input.normchoice == 'Tests'", verbatimTextOutput("mytest"))
)
))
server = function(input, output) {
var = reactive({
mtcars[, input$varchoice]
})
output$myplot = renderPlot({
if (input$plotchoice == "Histogram")
return(hist(var(), main = "Histogram", xlab = input$varchoice))
else
return(qqnorm(var(), main = paste("QQ plot of", input$varchoice)))
})
output$mytest = renderPrint({
shapiro.test(var())
})
}
shinyApp(ui, server)
Following is the clip of how the app will look when opened the link: |
| My First Shiny App |
Advanced Tutorial : Include custom JavaScript in Shiny App
You can check out this tutorial if you know basics of JS and CSS and want to customize your shiny app with your own code. With the use of CSS, you can give a new style to your app. JavaScript will also add more power in interactivity of app.
AWSM................great work...it gave a complete understanding of basic R which i needed
ReplyDeleteI am also enthusiast like you..
ReplyDeletegreat thanks @ Ekkta for this wonderful tutorial. like it
ReplyDeletethanks Ekta
ReplyDeleteGreat work, really helpful
ReplyDelete