In this tutorial, we will show how to perform ANOVA in SAS, along with examples.
ANOVA is used to check whether there is a statistically significant difference between the means of three or more independent groups.
The basic syntax for performing ANOVA in SAS is as follows.
proc anova data=mydata;
class categorical_variable;
model numeric_variable = categorical_variable;
means categorical_variable/ hovtest=levene(type=abs) tukey cldiff;
run;
proc anova data=mydata;: This line starts the ANOVA procedure in SAS and specifies the dataset named "mydata" that contains the variables you want to analyze.class categorical_variable;: Specify the variable "categorical_variable" as a categorical (grouping) variable for the ANOVA analysis.model numeric_variable = categorical_variable;: Specifies the ANOVA model. You are testing the effect of "categorical_variable" on the "numeric_variable."means categorical_variable/ hovtest=levene(type=abs) tukey cldiff;: Requests the Levene's Test for Homogeneity of Variances along with the means comparison for the levels of "categorical_variable" using the Tukey post hoc test. Thecldiffoption will display letter-based grouping for significant differences between the means.
A researcher invites 30 students to take part in a study. The students are divided randomly into three groups. Each group is assigned a unique studying method to use in their exam preparation. It is to check how the three different studying methods impact the students' performance in the upcoming exam. By comparing the results of the three groups, the researcher aims to determine if one studying method appears to be more effective than the others in helping the students achieve better exam scores.
Null Hypothesis (H0): μ1 = μ2 = μ3
Alternative Hypothesis (H1): At least one of the population means (μ1, μ2, or μ3) is different from the others.
Let's create a sample SAS dataset for the above example. We have 30 observations, with 10 students per studying method.
data sample_data;
  input methods $ score;
  datalines;
A 78
A 82
A 85
A 75
A 80
A 84
A 88
A 64
A 68
A 76
B 72
B 78
B 75
B 60
B 65
B 70
B 68
B 62
B 67
B 77
C 90
C 88
C 92
C 85
C 94
C 89
C 93
C 91
C 85
C 90
;
run;
The following code performs a one-way ANOVA analysis to test if there are significant differences in the "SCORE" variable among the different "METHODS" groups.
PROC ANOVA DATA=SAMPLE_DATA;
CLASS METHODS;
MODEL SCORE = METHODS;
MEANS METHODS / HOVTEST=LEVENE(TYPE=ABS) TUKEY CLDIFF;
RUN;
In one-way ANOVA, it is important to check for unequal variances.
- If variances are equal, then a Tukey's One-Way ANOVA is suitable.
- If variances are unequal, then a Welch's One-way ANOVA is suitable.

If the Levene's test p-value is less than 0.05, use a Welch's ANOVA. If P is greater than 0.05, use Tukey's one-way ANOVA. As we can see in the image above, p-value (0.0693) is greater than 0.05, we can use Tukey's one-way ANOVA. Please note that if p-value had been less than 0.05, we would have had to replace tukey with welch in the PROC ANOVA code.

Interpretation: Since the p-value (Pr > F) is less than the significance level 0.05, we can reject the null hypothesis. It means that the mean exam score is not equal between the three studying methods.
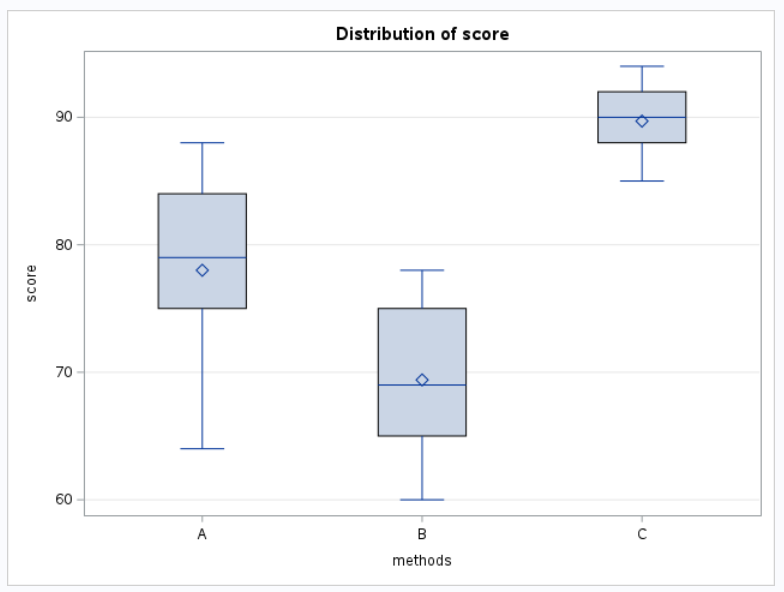
Interpretation: The boxplots above indicate that students who used studying method C got higher scores compared to those who used methods A and B.

Interpretation: Look at the last column having 3 stars (***) showing the comparison between 3 studying methods. As shown in the table above, all the methods' comparisons have 3 stars (***) against them. Hence we can conclude that the mean exam score for all the three methods (A, B and C) are statistically significantly different. Please note that if any of these method comparisons did not have three stars (***) against them, it would have indicated that they were not statistically significantly different.

Deepanshu founded ListenData with a simple objective - Make analytics easy to understand and follow. He has over 10 years of experience in data science. During his tenure, he worked with global clients in various domains like Banking, Insurance, Private Equity, Telecom and HR.
Share Share Tweet