In this guide, we will walk you through the steps to perform a Two-Way ANOVA in SAS.
Two-Way ANOVA (Analysis of Variance) is used to analyze the differences between the means of two or more groups when there are two independent variables (also known as factors).
The basic syntax for performing two-way ANOVA in SAS is as follows.
proc anova data=mydata;
class independent_variable1 independent_variable2;
model dependent_variable = independent_variable1 independent_variable2 independent_variable1*independent_variable2;
means independent_variable1 independent_variable2/ tukey cldiff;
run;
proc anova data=mydata;: This line starts the ANOVA procedure in SAS and specifies the dataset named "mydata" that contains the variables you want to analyze.class independent_variable1 independent_variable2;: Specify the factors (or independent variables) for the ANOVA analysis.MODEL dependent_variable = independent_variable1 independent_variable2 independent_variable1*independent_variable2: The MODEL statement specifies the dependent variable (response) and the two independent variables, along with their interaction term (independent_variable1*independent_variable2). This sets up the Two-Way ANOVA design.MEANS independent_variable1 independent_variable2 / TUKEY CLDIFF: The MEANS statement is used to request post hoc tests. TUKEY specifies that the Tukey's HSD (Honestly Significant Difference) test will be performed to compare all possible pairs of means. CLDIFF specifies that the test will include confidence intervals for the differences between means.
Steps to Perform Two-Way ANOVA in SAS
Step 1: Data Preparation
Before conducting a Two-Way ANOVA, make sure that your data is in the appropriate format. It should be organized with one column for each independent variable (factor) and one column for the dependent variable (response).
Suppose researcher wants to investigate the test scores of students. We have two independent variables: teaching method (FactorA: Methods) with three levels (Traditional, Online, Blended) and the students' study time (FactorB: StudyTime) with two levels (High, Low). The dependent variable is the test score (Y). The goal is to see if there are significant differences in test scores based on the teaching method, study time, or their interaction.
- Dependent Variable: TestScore (Continuous Variable)
- First Independent Variable (Factor A): Methods (Categorical with 3 levels)
- Second Independent Variable (Factor B): StudyTime (Categorical with 2 levels)
Let's create a sample SAS dataset for the above example. We have 60 observations, with 10 students per studying method and study time.
data sample_data;
  length methods $12.;
  input methods $ StudyTime $ score;
  datalines;
Traditional High 78
Traditional High 82
Traditional High 85
Traditional High 75
Traditional High 80
Traditional High 84
Traditional High 88
Traditional High 64
Traditional High 68
Traditional High 76
Online High 72
Online High 78
Online High 75
Online High 60
Online High 65
Online High 70
Online High 68
Online High 62
Online High 67
Online High 77
Blended High 90
Blended High 88
Blended High 92
Blended High 85
Blended High 94
Blended High 89
Blended High 93
Blended High 91
Blended High 85
Blended High 90
Traditional Low 76
Traditional Low 80
Traditional Low 82
Traditional Low 84
Traditional Low 77
Traditional Low 73
Traditional Low 70
Traditional Low 68
Traditional Low 65
Traditional Low 74
Online Low 65
Online Low 62
Online Low 68
Online Low 66
Online Low 70
Online Low 72
Online Low 75
Online Low 63
Online Low 67
Online Low 64
Blended Low 88
Blended Low 85
Blended Low 90
Blended Low 86
Blended Low 89
Blended Low 92
Blended Low 85
Blended Low 88
Blended Low 87
Blended Low 90
;
run;
Step 2: Run the Two-Way ANOVA
The following code performs a two-way ANOVA analysis to test if there are significant differences in test scores based on the teaching method, study time, and their interaction.
proc anova data=sample_data;
class methods studytime;
model score = methods studytime methods*studytime;
means methods studytime / tukey cldiff;
run;
Step 3: Interpret the Results
- P-value for methods: <.0001
- P-value for studytime: 0.0899
- P-value for methods*studytime: 0.9124
As shown in the p-values above, the variable "methods" is statistically significant factor of exam score. The variable "studytime" and the interaction between methods and studytime are not statistically significant factors of exam score.
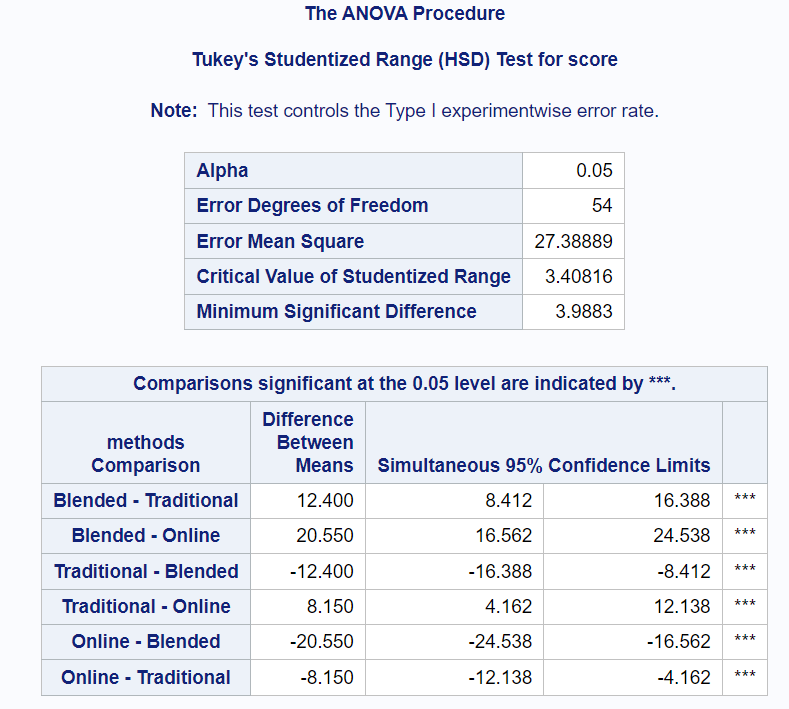
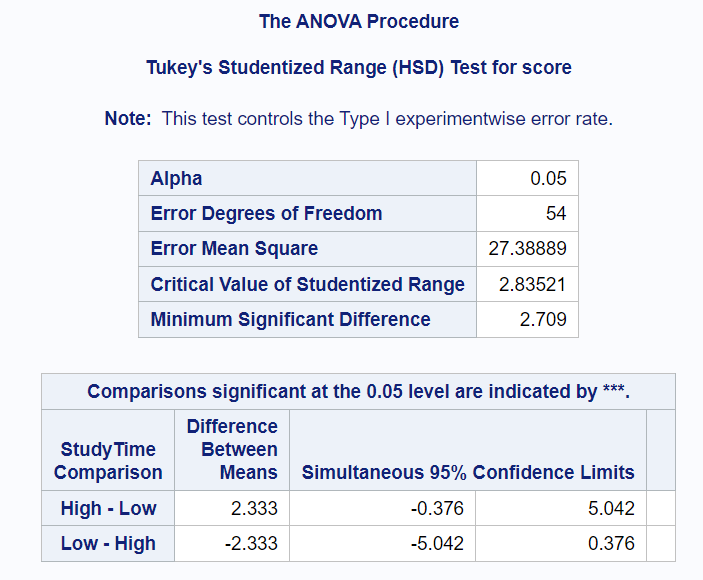
This table compares the means of "methods" and "studytime" levels to identify significant differences.
Look at the comparisons having stars (***) next to them. As you can see in the output shown in the image above, the means of all the levels of "methods" are statistically significantly different.
Interpretation of Confidence Interval: The mean difference in exam score between Blended and Traditional teaching methods is 12.4. The 95% confidence interval for the difference in mean score is [8.412, 16.388]. It means we are 95% confident that the true difference in mean score between Blended and Traditional teaching methods is between 8.412 and 16.388.
Since none of the levels of "studytime" have stars (***) next to them in the comparisons table, we can say that the means of the levels of "studytime" is not statistically significantly different.
Step 4: Conclusion
Our objective to perform two-way ANOVA was to check the effect of the teaching method and study time on exam score. A two-way ANOVA showed that the teaching methods is a statistically significant factor of exam score as p-value is less than 0.05. There was not a statistically significant interaction between the effects of teaching methods and study time as p-value (0.9124) is greater than 0.05. Also the study time factor did not have any effect on exam score as p-value (0.0899) is higher than the significance level (0.05).


Share Share Tweet