This article explains how to add column percentage in crosstab in SAS Visual Analytics.
Task
Suppose you have created a cross tab - variable1 by variable2. You want to show both frequency and count % of column total. In SAS Visual Analytics, there is no direct way to show percentage of column total in crosstab.
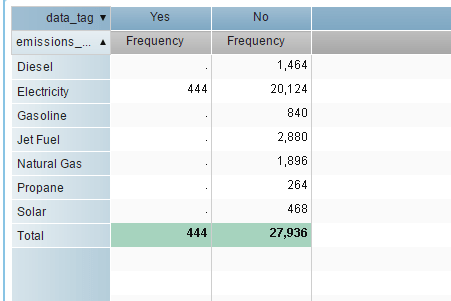 |
| SAS VA : Crosstab |
Solution
1. Add any measure variable that has
no missing values and change
aggregate of the variable to
count.
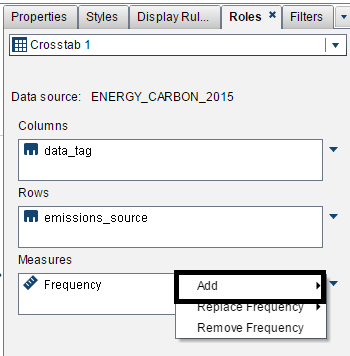 |
| Add a measure variable |
2. Place your cursor to the column you have added and right click on it
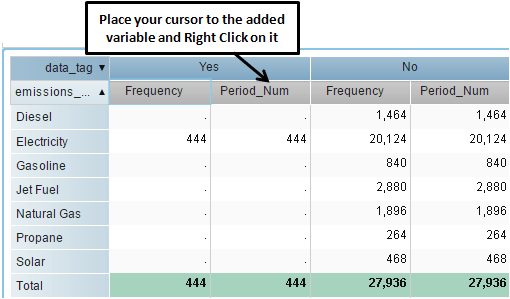 |
| Add aggregated measure |
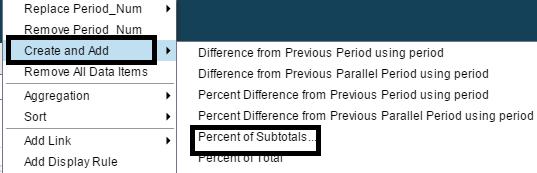
3. Select "Create and Add" and click on Percent of Subtotals.
 |
| Add caption |
4. Check "Percent of Column total.
5. Remove the added column and keep the percentage column.
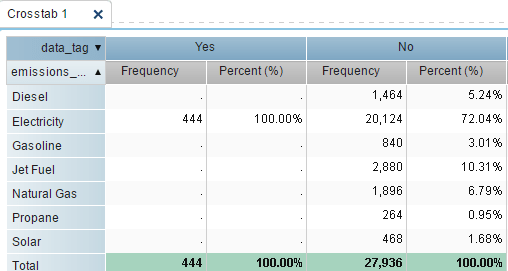 |
| Final CrossTab Table |
About Author:
Deepanshu founded ListenData with a simple objective - Make analytics easy to understand and follow. He has over 10 years of experience in data science. During his tenure, he worked with global clients in various domains like Banking, Insurance, Private Equity, Telecom and HR.


Thanks a lot
ReplyDeleteis there a way to add the row total also?
ReplyDeleteso basically i want to create a column which shows the share of A and B from the total
ReplyDelete