This tutorial explains how to train and test a logistic regression model in Excel with one click using an add-in.
This add-in is 100% free and can run on any version of MS Excel to build logistic regression models.
When we download add-in from internet, Microsoft blocks them from running and shows the source of this file is untrusted. Please follow the steps below to make it trusted.
- Go to the folder where the downloaded add-in file is located.
- Right-click the file and choose Properties from the menu.
- At the bottom of the General Tab, select the Unblock checkbox under security option and then click OK.
Refer the following steps to install Logistic Regression add-in.
- Open Excel and click on the
Filetab in the ribbon. - Click on
Optionsand then selectAdd-insfrom the left-hand menu. - In the
Managedrop-down menu at the bottom of the screen, selectExcel Add-insand click on theGobutton. - Click on the
Browsebutton and locate the add-in file that you downloaded. - Select the add-in file and click on the
OKbutton. - You should see the name of the add-in file called "LogisticRegression" in the
Add-Insdialog box. Check the box next to the add-in name to activate it. - Once you are done with the above steps, a new tab called
LogisticRegressionshould be visible in your Excel workbook.
Step 1 : Split Data into Training and Testing Sets
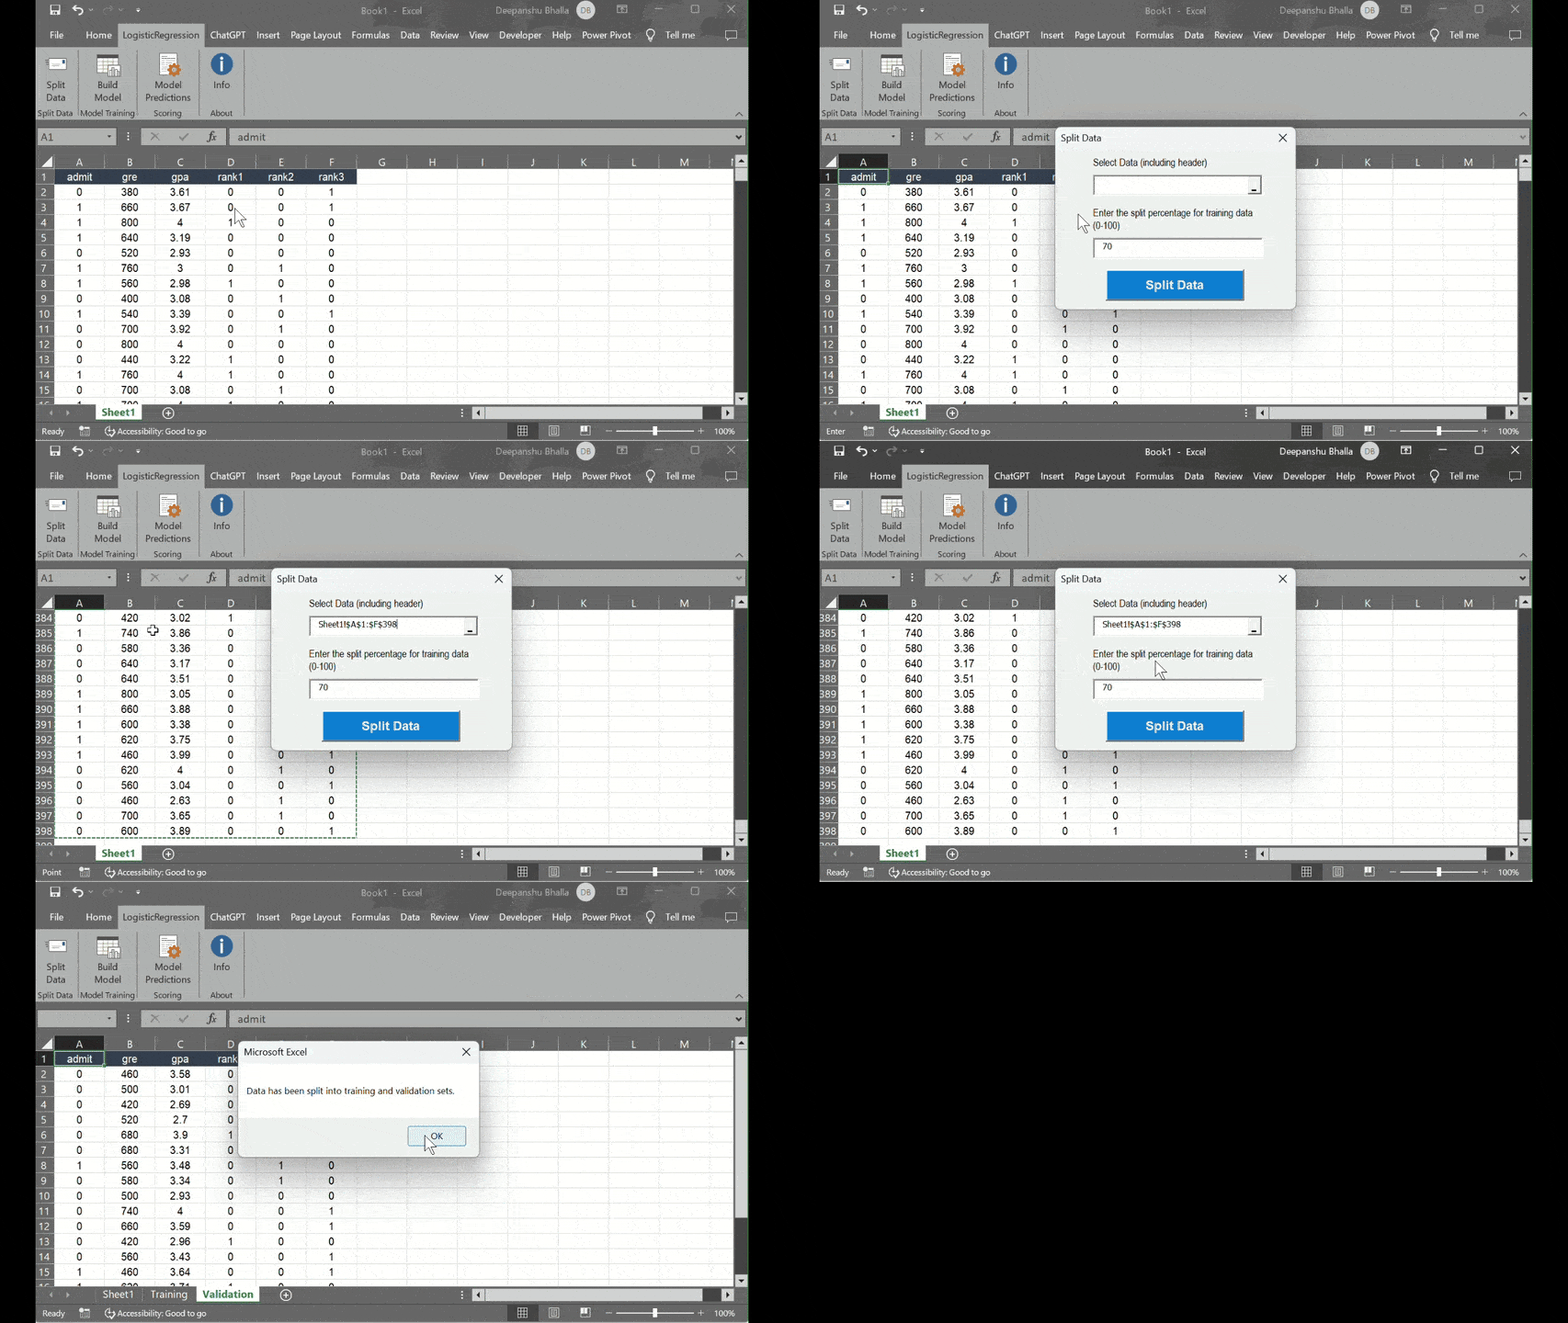
The first step of building a predictive model is to split data into training and validation data sets. In Excel, under the LogisticRegression tab, click on Split Data. It creates two sheets for training and testing data.
- Select Data (including header) : Select the cells containing data for both dependent and independent variables including their variable names.
- Enter the split percentage for training data : Enter a value between 0 and 100 for data to be used for training model. For example, 70 refers to 70% of the data used to train the model with the remaining 30% kept for testing.

Step 2 : Model Training
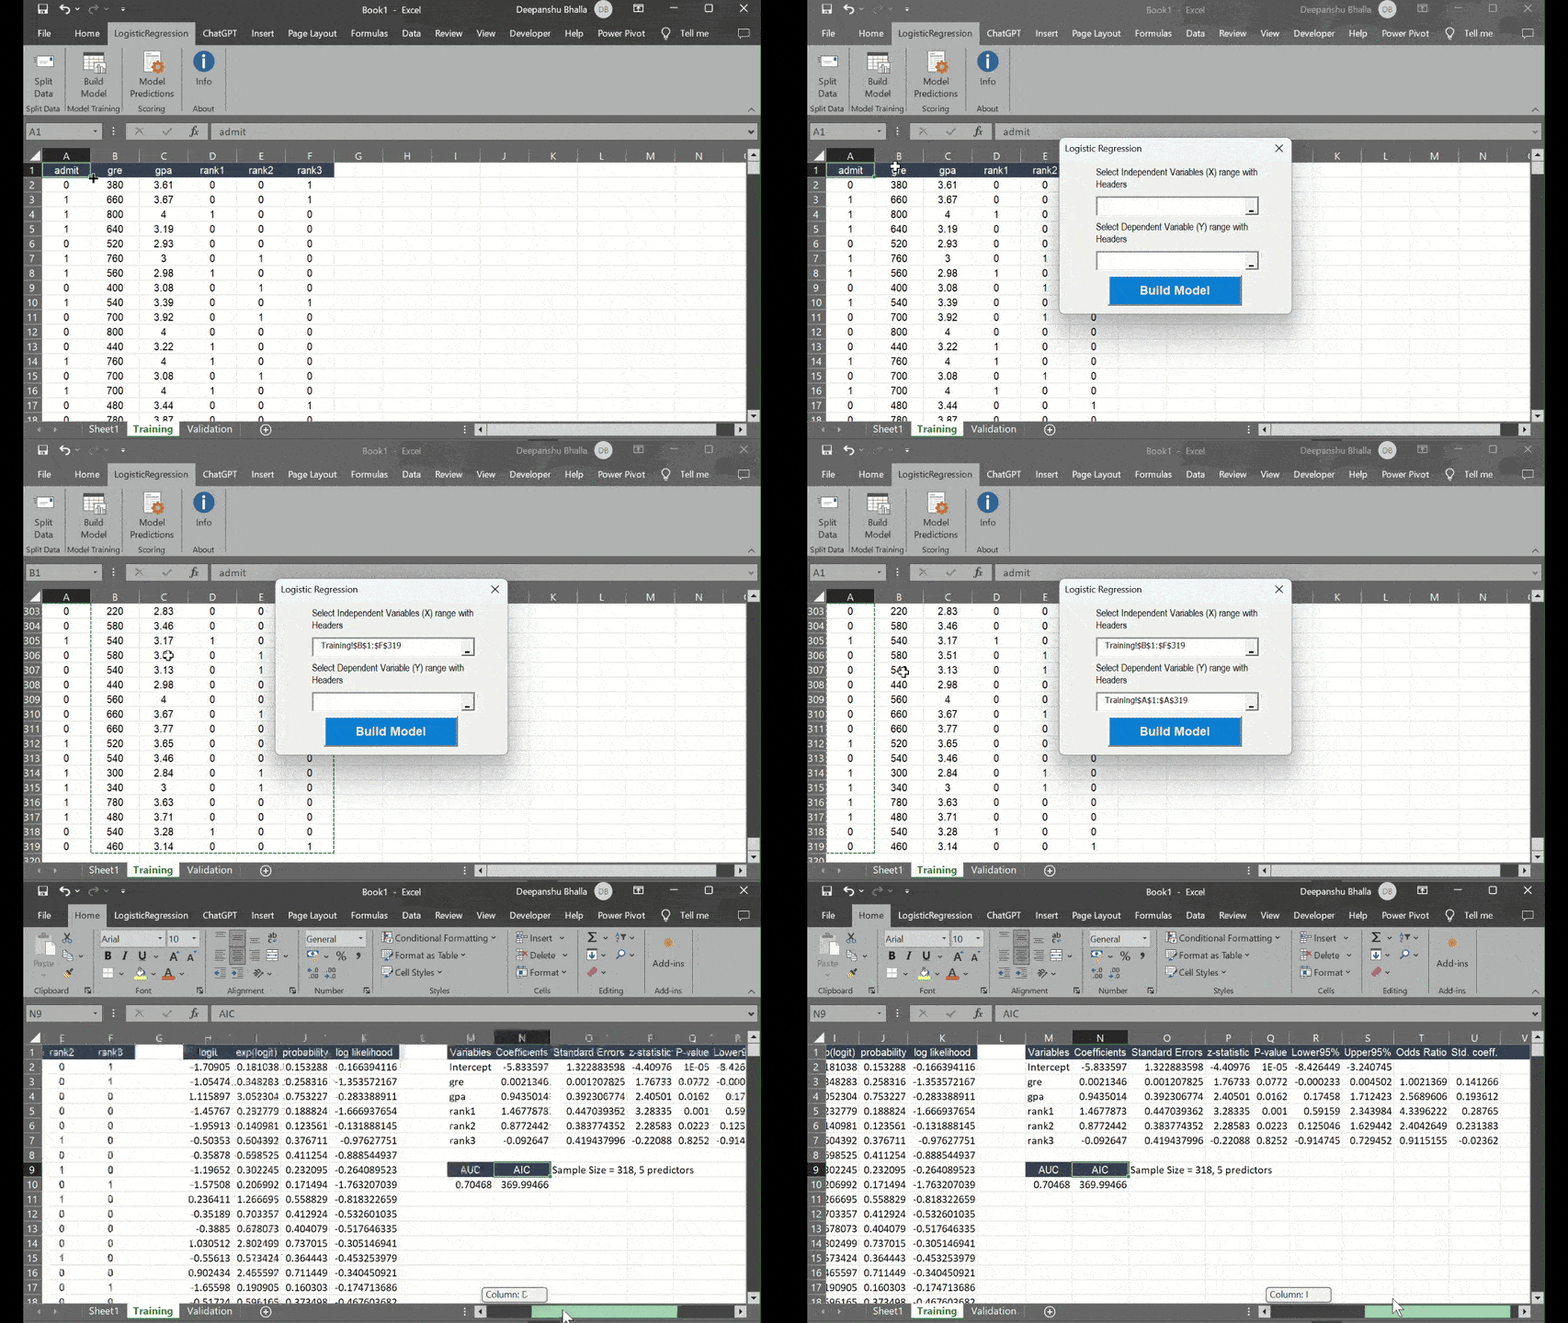
The next step is to fit the logistic regression model on the training data. In Excel, under the LogisticRegression tab, click on Build Model. It returns predicted probabilities along with coefficient table and model evaluation metrics such as AUC and AIC.
- Select Independent Variables : Select the cells containing independent variables including their variable names.
- Select Dependent Variable : Select the cells containing dependent variable including its variable name.

The add-in returns the following columns at observation level.
- Probability : Predicted probabilities for dependent event occuring i.e. prob(y=1).
- Log Likelihood : Log of predicted probabilities for actual dependent variable
The add-in returns the following metrics for indepedent variables in a tabular format.
- Coefficients: It estimates of the relationship between each independent variable and the log odds of the dependent event occurring.
- Standard Errors: It tells us the precision of the estimates.
- z-statistic: It is the ratio of a coefficient to its standard error.
- P-value: It shows the significance of the independent variable.
- Lower95%: The lower bound of the 95% confidence interval for the coefficient.
- Upper95%: The upper bound of the 95% confidence interval for the coefficient.
- Odds Ratio: It is the exponential value of coefficient.
- Std. coeff.: It is used to find out the relative importance of each independent variable.
The add-in returns the following metrics to check the performance of model.
- AUC: Area Under the ROC Curve. It measures how well model can distinguish between events(1) and non-events(0).
- AIC: Akaike Information Criterion. It measures the relative quality of a logistic regression model.
Step 3 : Predict on Testing Data
It refers to the process of using the trained logistic regression model to make predictions on a testing or validation dataset that was not used during the model building step. In Excel, under the LogisticRegression tab, click on Model Predictions. It returns predicted probabilities of testing dataset.
- Select Independent Variables : Select the cells containing independent variables. DO NOT include their variable names.
- Select Coefficients : Select the cells containing coefficients of variables including intercept.
You can check the model's performance based on the predictions.
You can use the AUC() formula to compute area under curve on testing or new data.
=AUC(probability_column,dependent_variable_column)
=AUC(G2:G80,A2:A80)
The confusion matrix is shown in the table below.
| Predicted Negative(0) | Predicted Positive(1) | |
|---|---|---|
| Actual Negative(0) | True Negative (TN) | False Positive (FP) |
| Actual Positive(1) | False Negative (FN) | True Positive (TP) |
In Excel, you can use the ConfusionMatrix() formula to calculate the following metrics.
- Accuracy
- True Positive Rate
- False Positive Rate
- True Negative Rate
- False Negative Rate
=ConfusionMatrix(probability_column,dependent_variable_column,threshold)
threshold: Threshold for converting probabilities to 0/1 predictions. Many softwares use threshold of 0.5 but it should be decided based on the youden-index.
=ConfusionMatrix(G2:G80,A2:A80,0.5)


Does it run on Mac as well? Please respond to c.lloyd@mbs.edu
ReplyDeleteYes. Are you facing any issue?
Delete